How to Use Shopify Order Reports to Calculate the True Net Revenue per Order After Discounts, Refunds, and Gateway Fees
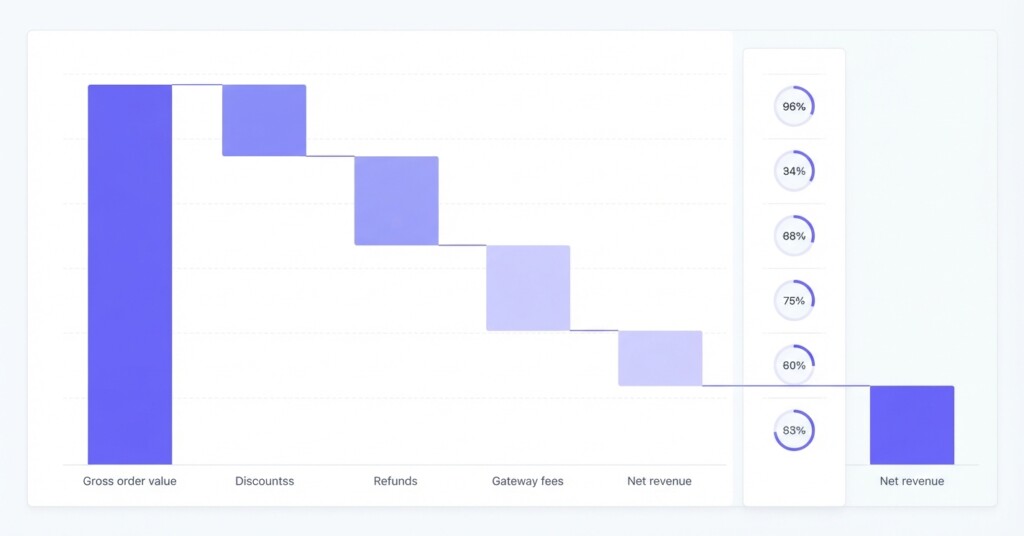
Most Shopify store owners look at their dashboard revenue figure and assume that is what they earned. It is not. The number Shopify displays as ‘Total Sales’ includes amounts that do not represent net merchant earnings — such as taxes collected for the government and customer-paid shipping — while omitting payment gateway fees deducted before funds reach your bank. Meanwhile, ‘Gross Sales’ ignores discounts and refunds altogether. If you are operating across multiple channels such as Shopify, Shopee, Lazada, and TikTok Shop, the gap between reported top-line figures and true net revenue can be significant enough to change how you evaluate a product, a promotion, or an entire channel.
This article walks through exactly how to use Shopify’s order reports to build a clean, accurate net revenue figure per order — one that reflects what your business actually collects after every deduction. The methodology applies whether you run a single Shopify store or a multi-channel operation with separate fulfillment and fee structures on each platform.
Why Gross Revenue Is a Misleading Starting Point
Shopify’s default reporting views can easily confuse merchants about real-world deductions. If a customer places a $150 order, uses a $20 discount code, and later requests a $30 partial refund on one item, Shopify reports $150 in ‘Gross Sales’ views, while ‘Total Sales’ factors in discounts, returns, and taxes. Meanwhile, your payment gateway has already taken a 2–3% processing fee on the original transaction amount — a fee that major gateways do not refund to you even when you return money to the customer.
The difference between Gross Sales and True Net Revenue is not a rounding error. Across hundreds of orders per month, it can represent 8–15% of your reported revenue — funds you counted but never received.
Understanding the correct deduction sequence matters because each line item behaves differently. Discounts reduce the transaction value before payment is processed. Refunds reduce your collected revenue after payment, but payment processors do not return the original gateway fees. Taxes are collected on behalf of a government and are not your revenue at all. Getting this calculation right per order gives you a foundation for accurate margin analysis.
The Four Reports You Need Inside Shopify
Shopify provides several built-in reports relevant to this calculation. You do not need a third-party tool to get started, but you do need to know which reports to combine and what each one actually measures.
- Total sales by order — shows gross sales, discounts, returns (sales reversals), net sales, shipping charged, and taxes per order. This is your primary data source.
- Payments — shows the payment gateway used per order, the amount processed, and any associated transaction fees if you use Shopify Payments.
- Returns (or Sales reversals) — provides a detailed view of refunded items and order adjustments, including whether shipping was refunded and the transaction date.
- Finance Summary — a high-level reconciliation useful for cross-checking totals across a reporting period.
If you use Shopify Payments, gateway fees are visible directly inside the Payments report and payout transaction exports. If you use a third-party gateway such as PayPal, Stripe, or a regional provider common in Southeast Asian markets, you will need to pull the fee data separately from that provider’s dashboard and match it to your Shopify order IDs.

Building the Net Revenue Calculation per Order
The correct sequence for calculating true net revenue per order follows a consistent formula. Work through each deduction in the order it occurs, and you will arrive at a figure that represents what the business genuinely collected.
| Gross Order Value (items ordered at full price) | $150.00 |
| Less: Discount Applied at Checkout | −$20.00 |
| Subtotal After Discount | $130.00 |
| Add: Shipping Revenue Charged to Customer | +$8.00 |
| Less: Taxes Collected (GST / VAT — not your revenue) | −$12.73 |
| Less: Refund Issued (partial, one item returned) | −$30.00 |
| Less: Payment Gateway Percentage Fee (2.6% on original $138 processed) | −$3.59 |
| Less: Payment Gateway Fixed Fee (non-refundable) | −$0.30 |
| True Net Revenue per Order | $91.38 |
Notice how an order that looked like $150 in gross sales delivers just $91.38 in true net revenue — a 39% reduction. This is not an extreme example. Any order involving a meaningful discount, a partial refund, and a standard gateway fee will produce this kind of gap. Scale this across a month of high-volume promotional activity and the distortion becomes very material.
Payment gateway fees on refunds are not returned by major processors. When you refund a customer, providers like Shopify Payments, Stripe, and PayPal retain the entire original transaction fee — both the percentage component and the fixed per-transaction fee. At scale, these lost processing fees add up quickly and do not appear as line-item deductions in Shopify’s standard sales reports.
How Shopify's Own 'Net Sales' Figure Falls Short
Shopify calculates a ‘Net Sales’ figure in the Total sales by order report, defined as Gross Sales minus Discounts minus Returns (or Sales Reversals). This is a useful intermediate step, but it is not the same as true net revenue. While Net Sales properly excludes taxes and shipping charges, it completely omits payment gateway fees (which reduce what you actually bank). Conversely, Shopify’s ‘Total Sales’ adds taxes and shipping back in. If you rely solely on Net Sales or Total Sales to evaluate order profitability or channel performance, you are working with an incomplete metric.
For a business selling across Shopify and marketplace channels like Shopee or Lazada simultaneously, the problem compounds. Shopee and Lazada deduct platform commissions (often 4–10% or more depending on category, seller tier, and campaign), payment transaction fees (typically 2–3.27%), and service fees before remitting funds to you. The remittance you receive bears little resemblance to the order value that was reported in your seller dashboard on the day of sale.
A Practical Comparison Across Channels
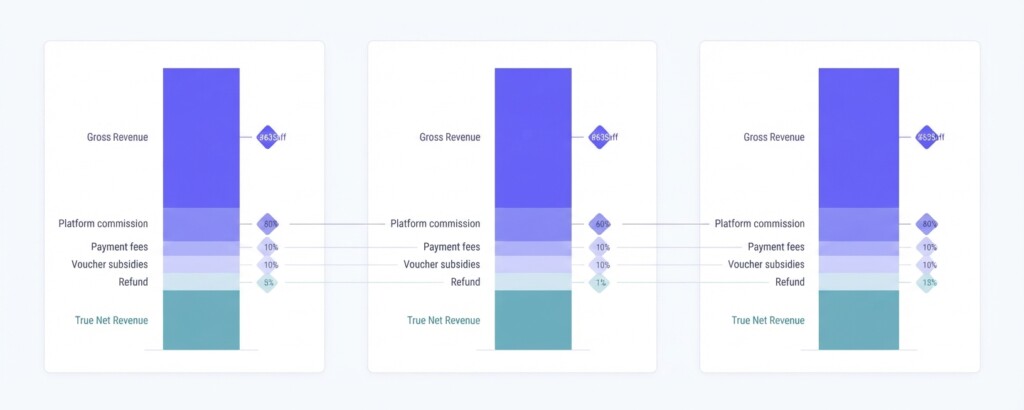
Consider a single product — a skincare set retailing at $80 — sold simultaneously on Shopify, Shopee, and TikTok Shop. The gross order value is identical, but the net revenue retained varies significantly by channel once all fees are applied.
| Metric | Shopify (own store) | Shopee | TikTok Shop |
|---|---|---|---|
| Gross Order Value | $80.00 | $80.00 | $80.00 |
| Platform Commission | Nil | −$3.20 (4%) | −$2.40 (3%) |
| Payment / Transaction Fee | −$2.38 (2.9%+$0.30) | −$1.60 (2%) | −$1.60 (2%) |
| Discount / Voucher Subsidy | −$5.00 | −$8.00 (platform campaign) | −$10.00 (creator incentive) |
| Estimated Refund Rate Impact | −$2.00 | −$3.50 | −$4.80 |
| True Net Revenue (est.) | $70.62 | $63.70 | $61.20 |
| Net Revenue as % of Gross | 88.3% | 79.6% | 76.5% |
The same product generates meaningfully different net revenue depending on where it sells. A manager looking only at gross sales volume would see TikTok Shop as an equal or superior channel if unit volumes are high. But the net revenue per order tells a different story — one that directly affects whether a product is profitable after cost of goods.
Step-by-Step: Exporting and Enriching Your Shopify Data
To build a reliable net revenue calculation at order level, follow this workflow using Shopify’s export functionality combined with your gateway’s fee data.
- Go to Shopify Admin → Analytics → Reports → Total sales by order. Set your date range and export to CSV.
- Open the CSV and identify columns: Gross Sales, Discounts, Returns (or Sales Reversals), Net Sales, Shipping, Taxes.
- Export your payment transactions from Shopify Payments (under Finance → Payouts or Transactions) or your third-party gateway for the same date range, including fee amounts per transaction.
- Use the Order ID as a join key to match gateway fees to each order row in your spreadsheet.
- Add a column: ‘Order Revenue’ = Net Sales + Shipping (Net Sales already excludes taxes).
- Add a column: ‘Gateway Fee’ from your payment transactions export.
- Ensure unreturned processing fees on refunded orders are captured, as gateways retain the original processing fees when refunds occur.
- Calculate True Net Revenue = Net Sales + Shipping − Gateway Fee.
- For marketplace channels, replace steps 3–7 with the platform’s seller settlement report, which typically shows gross order value and all fee deductions in a single remittance statement.
What to Do With the Number Once You Have It
True net revenue per order becomes useful when you connect it to your cost of goods sold (COGS) and fulfilment costs. At that point, you can calculate contribution margin per order — the amount each transaction actually contributes to covering your overhead and generating profit. This is the number you should be optimising, not gross sales volume.
If you are managing several channels simultaneously, ranking them by average contribution margin per order (rather than GMV or order count) will often reveal that your highest-volume channel is not your most profitable one. Businesses running on tools like BrizoMarket can automate the reconciliation across Shopify and marketplace channels, pulling settlement data and mapping it to order-level net revenue without manual CSV exports — which matters significantly once you are processing hundreds or thousands of orders per month.
Even without automation, running this calculation manually on a monthly basis gives you the data to make better decisions: which discount codes are destroying margin, which refund-prone products need attention, and which channels deserve more inventory allocation.
Common Mistakes to Avoid
- Using Shopify’s dashboard ‘Total Sales’ as your revenue figure in profit and loss reports — it includes collected sales taxes and shipping charges while omitting payment processing fees.
- Treating marketplace remittance dates as the sale date — the order date and the settlement date can be weeks apart, causing period mismatches in your accounts.
- Ignoring voucher subsidies absorbed by the seller — on Shopee and Lazada campaigns, some voucher costs are co-funded by the platform and some are charged to the seller; always check your settlement statement.
- Assuming gateway fees are refunded when you issue customer refunds — major payment processors retain original processing fees in full.
- Benchmarking channel performance using gross GMV rather than net revenue, which systematically flatters high-discount, high-refund channels.
Key Takeaway and Next Steps
True net revenue per order is not a complex concept, but it requires deliberate effort to calculate correctly from Shopify’s reports. The formula is straightforward: start with gross sales, subtract discounts and returns to get Shopify’s net sales figure, add shipping charged to the customer, ensure taxes remain excluded, then deduct gateway fees. The result is the amount your business actually collected from that order.
If you operate across multiple channels, apply the same logic to each platform’s settlement report. The differences in net revenue retention between Shopify, Shopee, Lazada, and TikTok Shop are real and consequential — and they should directly inform your channel strategy, pricing decisions, and promotion planning. Start with one month of orders, build the calculation in a spreadsheet, and you will have an immediate, actionable view of where your revenue is actually going.
Automate Your Multi-Channel Net Revenue Reporting
Manually reconciling Shopify exports with marketplace settlement reports takes time and introduces errors. BrizoMarket connects your sales channels and maps order-level revenue, fees, and costs into clean, comparable profitability reports — so you can spend less time in spreadsheets and more time acting on the numbers.