How to Use Shopee Seller Centre Product Reports to Identify Which Listings Have the Highest Views but the Lowest Add-to-Cart Rate
If you sell on Shopee, you already know that traffic alone does not pay your bills. A listing can attract thousands of views every week and still generate almost no revenue if shoppers are not adding it to their cart. The gap between views and add-to-cart is one of the most actionable signals in your Shopee Seller Centre data — yet most sellers never look at it systematically.
This article walks through exactly how to pull the right product-level reports from Shopee Seller Centre, calculate your add-to-cart rate per listing, interpret what the numbers mean, and decide what to do about listings that are bleeding impressions without converting. The same analytical framework applies whether you are running a single Shopee store or managing inventory across Shopee, Lazada, Shopify, and TikTok Shop simultaneously.
Why Views-to-Cart Rate Matters More Than Views Alone
Views (specifically product page views) represent the number of times a listing page was opened, whereas impressions refer to when your listing appears in search results or browse feeds. Add-to-cart is the action a shopper takes when they signal genuine purchase intent. The ratio between the two — your add-to-cart rate — tells you whether the listing is doing its job once a shopper arrives.
A listing with 10,000 views and 50 add-to-carts has a 0.5% add-to-cart rate. A listing with 1,000 views and 80 add-to-carts has an 8% rate. The second listing is converting sixteen times more effectively per view. If you are running Shopee Ads or boosting listings, you are spending money to send traffic to both — but only one of them is worth the spend.
Add-to-cart rate is calculated as: (Add-to-Cart Events ÷ Product Page Views) × 100. A healthy rate varies by category, but consistently analysing your own store’s distribution will reveal your underperformers more reliably than any industry benchmark.
Step 1 — Pull the Right Report from Shopee Seller Centre
Log into Shopee Seller Centre and navigate to the ‘Data’ section. From there, go to ‘Business Insights’, click on the ‘Product’ tab, and select ‘Product Performance’. This section gives you product-level performance data including page views, add-to-cart counts, and units sold over your selected date range.
- In Seller Centre, click ‘Data’ in the left navigation menu.
- Select ‘Business Insights’ from the menu.
- Click the ‘Product’ tab and select ‘Product Performance’ to open the product performance table (use ‘Select Metrics’ if you need to ensure Page Views and Add to Cart are displayed).
- Set your date range — a 30-day window gives a statistically meaningful sample without being too broad.
- Export the data as an Excel or CSV file using the ‘Export Data’ button in the top-right corner of the table.
- Open the exported file in a spreadsheet tool such as Google Sheets or Excel.
The exported file will include columns for product name, product ID, views, add-to-cart count, units sold, and revenue. You may need to scroll right to find all columns depending on your export settings.
Step 2 — Calculate Add-to-Cart Rate for Every Listing
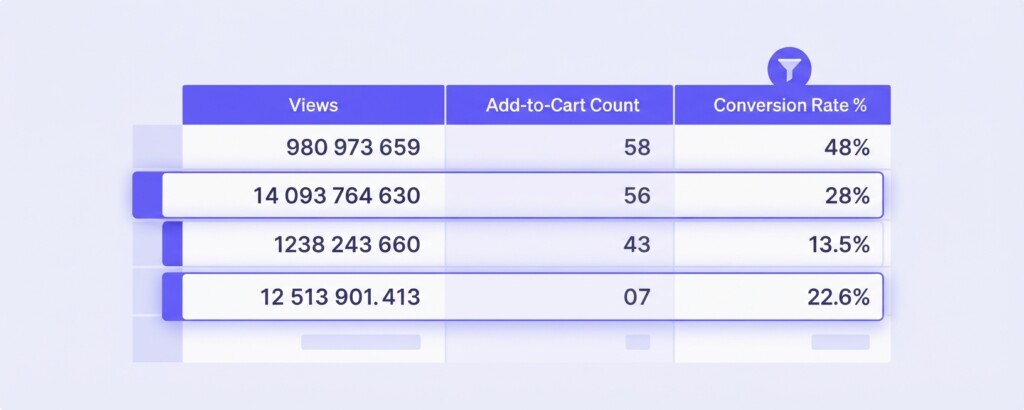
Once you have the CSV open, add a new column labelled ‘Add-to-Cart Rate %’. In the first data row, enter the formula: = (Add-to-Cart Column ÷ Views Column) × 100. Apply this formula down the entire dataset. Any listing with zero views should be excluded from the analysis — it has not received traffic yet, which is a separate problem.
Now sort the data by views from highest to lowest. This surfaces your highest-traffic listings at the top. Add a secondary sort on add-to-cart rate from lowest to highest. The listings at the top of your sorted list — high views, low add-to-cart rate — are your priority targets for investigation.
| Listing Name | Views (30 days) | Add-to-Cart | ATC Rate % | Units Sold | Status |
|---|---|---|---|---|---|
| Wireless Earbuds Model X | 9,840 | 112 | 1.1% | 43 | High views, low ATC — investigate |
| Cotton Tote Bag 3-Pack | 7,200 | 864 | 12.0% | 390 | Strong performer |
| Stainless Steel Tumbler | 6,500 | 97 | 1.5% | 31 | High views, low ATC — investigate |
| Bamboo Cutting Board Set | 4,100 | 492 | 12.0% | 201 | Strong performer |
| Phone Stand Adjustable | 3,900 | 55 | 1.4% | 18 | High views, low ATC — investigate |
| Reusable Straw Set | 2,200 | 330 | 15.0% | 158 | Strong performer |
In the example above, the Wireless Earbuds, Stainless Steel Tumbler, and Phone Stand are each receiving significant traffic but converting at a fraction of the rate of comparable listings in the same store. That disparity is not random — it points to specific listing problems that can be diagnosed and fixed.
Step 3 — Diagnose Why High-View Listings Have Low Add-to-Cart Rates
When a shopper views a listing but does not add it to cart, one of several things has gone wrong. The listing attracted the wrong shopper through keyword mismatch, or it attracted the right shopper but failed to build enough confidence or desire. Work through the following diagnostic checklist for each underperforming listing.
- Price competitiveness: Search for the same product on Shopee and check competitor pricing. If your listing is significantly more expensive without a clear reason, shoppers will leave.
- Main image quality: The first image must clearly show the product, ideally on a clean background with the key benefit visible at thumbnail size.
- Title clarity: Does the title describe exactly what the product is and who it is for? Keyword stuffing without clarity repels buyers.
- Shipping cost visibility: High or unclear shipping fees are a leading cause of cart abandonment and add-to-cart hesitation.
- Stock availability: If a listing has low stock or variants are frequently out of stock, Shopee may still display it but shoppers cannot complete the action.
- Review count and rating: A listing with fewer than five reviews or a rating below 4.5 may receive traffic from search but lose shoppers to competitors with more social proof.
- Description and specifications: Technical products especially require clear spec tables. Missing details create doubt.
- Variant selection friction: If a product has many variants and the default selection is unclear, shoppers may abandon rather than figure it out.
Do not immediately discount the price on a low-ATC listing without first diagnosing the root cause. If the problem is a poor main image or missing specifications, discounting will not fix the conversion rate — it will only reduce your margin on future sales.
Step 4 — Cross-Reference with Profitability Before Making Changes
Before you invest time optimising a listing, confirm that converting more of those views would actually be profitable. A high-view, low-ATC listing on a product with thin margins may not be worth the effort. Use this quick contribution margin calculation to validate.
| Selling price per unit (after Shopee commission ~3-5%) | SGD 38.00 |
| Less: Product cost (COGS) | – SGD 14.00 |
| Less: Shopee transaction and payment fee (~2%) | – SGD 0.76 |
| Less: Shipping subsidy or voucher contribution | – SGD 3.00 |
| Less: Shopee Ads cost (estimated per unit at current CTR) | – SGD 4.50 |
| Contribution margin per unit | SGD 15.74 |
If the contribution margin is positive and meaningful, improving the add-to-cart rate is worth your time. If margins are already compressed and the listing is only getting traffic because of ad spend, you need to evaluate whether the listing should remain active at all — or whether the ad budget would be better redirected to your strong performers.

Step 5 — Prioritise Actions Using a Simple Scoring Matrix
Not every underperforming listing deserves equal attention. Build a simple priority score by multiplying views by the potential uplift. If a listing has 9,000 views and an ATC rate of 1%, improving it to 5% would generate approximately 360 additional add-to-carts per month. Multiply that by your conversion rate from cart to purchase and your average order value — now you have an estimated revenue uplift to weigh against your optimisation effort.
| Listing | Monthly Views | Current ATC % | Target ATC % | Estimated Additional Add-to-Carts | Priority |
|---|---|---|---|---|---|
| Wireless Earbuds Model X | 9,840 | 1.1% | 5.0% | ~384 | High |
| Stainless Steel Tumbler | 6,500 | 1.5% | 5.0% | ~228 | High |
| Phone Stand Adjustable | 3,900 | 1.4% | 5.0% | ~140 | Medium |
| Cotton Tote Bag 3-Pack | 7,200 | 12.0% | 15.0% | ~216 | Low — already strong |
Applying This Analysis Across Multiple Channels
If you sell the same products on Lazada, TikTok Shop, and Shopify in addition to Shopee, run the same views-to-add-to-cart analysis on each platform separately. Shopee’s Product Performance report covers Shopee data only. Lazada has a similar Business Advisor tool, and Shopify provides a comparable product performance report under Analytics.
What you will often find is that the same product listing performs very differently across channels. A product may have an 8% ATC rate on Shopify where your brand authority is established, but only 1.5% on Shopee where you are competing in a price-sensitive marketplace environment. This means the problem is channel-specific, not product-specific — and your fix needs to be calibrated accordingly.
For sellers managing data from multiple platforms, tools like BrizoMarket can consolidate channel-level and product-level performance into a single view, making it easier to compare how the same SKU is converting across Shopee, Lazada, and Shopify without manually downloading and merging reports each week.
What to Actually Change on an Underperforming Listing
Once you have identified your high-view, low-ATC listings and confirmed they are worth fixing, make changes one variable at a time so you can measure what works. The most impactful changes in order of typical effectiveness are:
- Replace the main listing image with a higher-quality version that clearly shows the product and its key benefit at a glance.
- Update the title to lead with the most specific product descriptor rather than keyword clusters.
- Add a comparison table or specification table in the description for products where technical details drive decisions.
- Review competitor pricing and adjust if you are more than 15% above comparable listings without a differentiating reason.
- Add or request reviews — even a few genuine reviews improve social proof significantly.
- Reduce shipping friction by joining Shopee’s free shipping programmes or making the shipping cost more transparent in the listing description.
- If the product has multiple variants, set the most popular or best-value option as the default selection.
After making changes, wait a minimum of two weeks before comparing the add-to-cart rate again, using the same date-range methodology from Step 1. Shorter windows can produce misleading results due to natural weekly traffic fluctuations on the platform.
Key Takeaway and Next Steps
High views with low add-to-cart is not a traffic problem — it is a listing quality and relevance problem. Shopee Seller Centre gives you the data to find exactly which listings have this gap. The analysis takes less than 30 minutes if you follow the five-step process above, and the revenue impact of fixing even one or two high-traffic underperformers can be significant when you calculate it through to contribution margin.
Make this a monthly review habit rather than a one-time exercise. Product performance shifts as competitors enter the market, as platform algorithms evolve, and as your customer base changes. The sellers who compound their advantage on Shopee are the ones who look at their data consistently and make deliberate, margin-aware decisions based on what it shows.
Analyse Your Product Performance Across Every Channel
If you are managing listings on Shopee, Lazada, Shopify or TikTok Shop and want a clearer view of which products are driving profit and which are draining your ad budget, BrizoMarket can help you bring it all together.