How to Use Lazada Seller Centre Product Reports to Identify Which Listings Have the Highest Traffic but the Lowest Conversion Rate
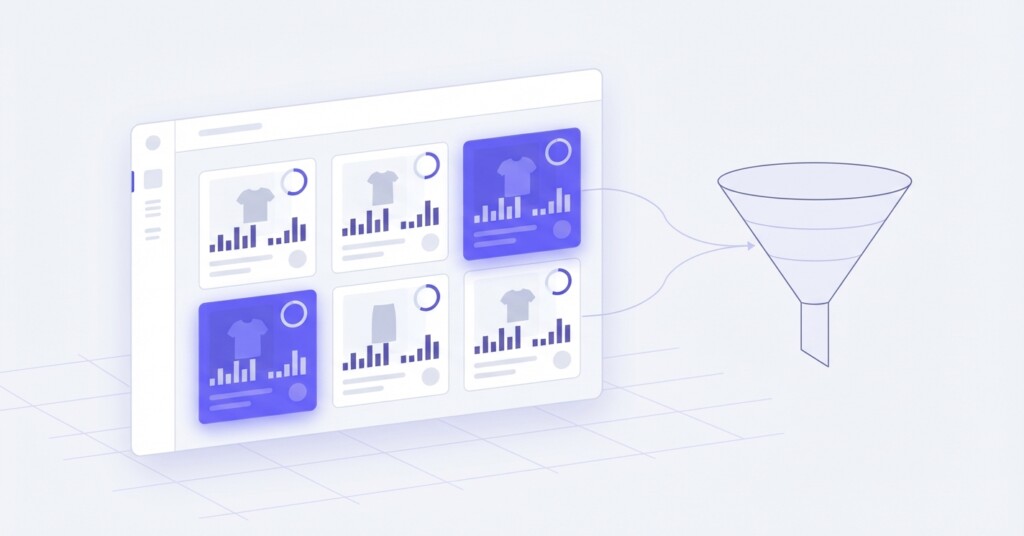
If you are running a multi-channel e-commerce business across Lazada, Shopee, Shopify and TikTok Shop, you already know that traffic alone does not pay the bills. A product listing that attracts thousands of visitors but converts only a handful of buyers is quietly consuming your advertising spend, your ranking budget and your team’s optimisation time — all without delivering a return.
Lazada Seller Centre provides a surprisingly detailed suite of product-level reports that let you identify exactly where this disconnect is happening. The challenge is knowing which reports to run, which metrics to combine, and how to interpret the results in a way that drives real action. This article walks you through that process step by step.
Why High-Traffic, Low-Conversion Listings Are a Profitability Problem
Before diving into the reports, it is worth being precise about why this matters financially. When a listing receives high organic or paid traffic but fails to convert, the costs accumulate in several ways. If you are running Lazada Sponsored Solutions (such as Sponsored Discovery or Sponsored Display), every click that does not result in a sale directly reduces your Return on Ad Spend (ROAS). If the traffic is organic, you are still paying an opportunity cost — ranking on page one for a competitive keyword has value, and failing to convert that position is a missed revenue contribution.
The financial impact compounds across a catalogue. Suppose you have 80 active SKUs on Lazada. If 15 of them account for 40% of total listing traffic but only 8% of total orders, those 15 listings are creating a structural drag on your overall channel conversion rate, suppressing your Lazada store score, and potentially reducing your eligibility for platform promotional campaigns.
A useful benchmark: on most Lazada categories, a healthy product-level conversion rate sits between 2% and 6%, depending on category, price point and whether the listing uses LazMall or standard seller status. If a high-traffic listing is converting below 1%, it warrants immediate investigation.
Step 1 — Locating the Right Reports in Lazada Seller Centre
Log into Lazada Seller Centre and navigate to the ‘Business Advisor’ section (accessible from the main navigation menu or under ‘Data Insight’). Depending on your market (Malaysia, Philippines, Thailand, Indonesia, Singapore or Vietnam), the interface labels may differ slightly, but the core reporting modules are consistent.
The two primary reports you need are the Product Performance report (under the Products tab) and the Traffic report. Within Product Performance, you can filter by date range, category and individual SKU. The key columns to enable are: Page Views (PV), Unique Visitors (UV), Orders, Conversion Rate (CR), and Revenue.
- Go to Seller Centre → Business Advisor → Products (or Product Analysis)
- Set your date range to the last 30 days (avoid shorter windows that may distort conversion data)
- Export the full product list to CSV, including Page Views, Unique Visitors, Units Sold, Orders and Revenue
- In a separate tab, open Traffic to understand how each product is receiving its visitors (search, recommendations, advertising or external)
- Cross-reference the two exports using SKU ID as the common key
Step 2 — Building Your Traffic vs Conversion Matrix
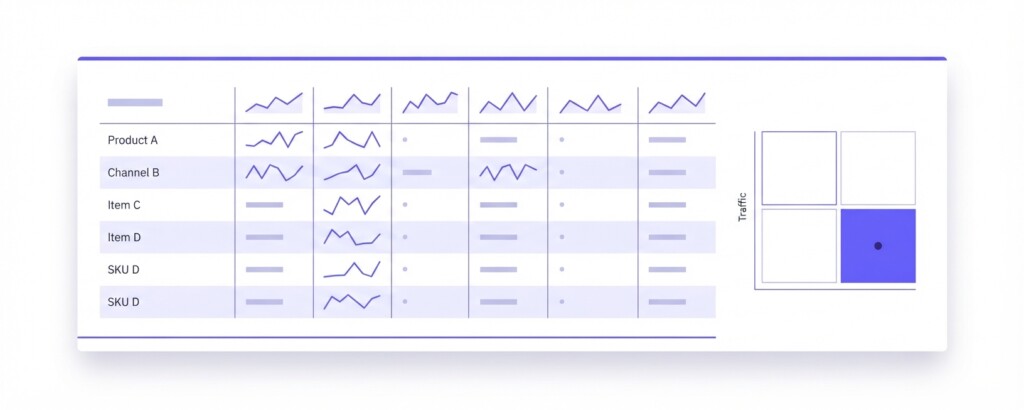
Once you have your CSV export, the analysis is straightforward. Create a simple scoring matrix by sorting your products into four quadrants based on traffic volume and conversion rate. This immediately separates your problem listings from your performers.
| Quadrant | Traffic Volume | Conversion Rate | Strategic Action |
|---|---|---|---|
| Star Listings | High | High | Protect ranking, increase stock, run promotions |
| Conversion Problem | High | Low | Priority optimisation — this article’s focus |
| Hidden Gems | Low | High | Increase traffic via ads or SEO improvements |
| Dead Weight | Low | Low | Review for delisting or complete overhaul |
For a practical threshold, define ‘High Traffic’ as any listing in the top 30% of your catalogue by Page Views over the period. Define ‘Low Conversion’ as any listing with a conversion rate below your catalogue average. Your catalogue average is simply: total orders across all listings ÷ total page views across all listings × 100.
Step 3 — Diagnosing Why High-Traffic Listings Fail to Convert
Once you have identified your ‘Conversion Problem’ quadrant listings, the next step is diagnosis. There are five common root causes, and each has a different fix.
The first is a price mismatch. If the listing is appearing in search for a category where competitors are priced 15–25% lower, visitors are window-shopping rather than buying. Pull the Traffic data to confirm whether these visitors are arriving via keyword search (which suggests competitive intent) rather than recommendations (which is more browsing behaviour).
The second cause is poor listing quality. Even with strong traffic, a listing with weak images, missing specifications, or an unconvincing product description will bleed visitors. Lazada’s own data shows that listings with fewer than five images and no product video tend to underperform on conversion versus category average.
The third cause is review deficit. A product with hundreds of visitors but fewer than ten reviews — especially with no star ratings visible — creates buyer hesitation. This is particularly acute in categories such as health, beauty and electronics where social proof drives purchase confidence.
The fourth is keyword-traffic mismatch. Sometimes a listing ranks well for a keyword that does not accurately describe the product. Visitors arrive with one expectation and leave when reality does not match. Review which keywords are driving traffic in your Sponsored Solutions dashboard and cross-check whether they align with what the product actually delivers.
The fifth cause is fulfilment friction. Long estimated delivery times, no Fulfilled by Lazada (FBL) badge, or no return guarantee all reduce conversion for price-sensitive categories. These are operational factors you can address without changing the listing content itself.

Step 4 — Calculating the Revenue at Stake
Before investing time in optimising a listing, it is worth quantifying what improved conversion would actually be worth. This calculation keeps the analysis grounded in business impact rather than vanity metrics.
| Current Monthly Page Views (listing A) | 3,200 PV |
| Current Conversion Rate | 0.6% |
| Current Monthly Orders | 19 orders |
| Average Order Value | RM 85 |
| Current Monthly Revenue | RM 1,615 |
| Target Conversion Rate (category average) | 2.5% |
| Projected Orders at Target CR | 80 orders |
| Projected Monthly Revenue at Target CR | RM 6,800 |
| Revenue Uplift Opportunity | RM 5,185 / month |
In this example, a single listing with a conversion problem represents over RM 5,000 in monthly revenue that is being left behind. Multiply this across a catalogue where ten or fifteen listings share the same profile, and the total opportunity is significant. This calculation should be your justification for prioritising listing optimisation over launching new products.
Step 5 — Prioritising Which Listings to Fix First
Not all high-traffic, low-conversion listings deserve equal attention. Prioritise using a simple scoring approach that weights three factors: volume of traffic, gross margin of the product, and the gap between current conversion rate and category benchmark.
A product with 5,000 monthly page views, a 40% gross margin and a conversion rate of 0.4% against a category average of 3% is a far higher priority than a product with 500 page views and a 15% margin at 1.5% conversion against a 2% benchmark. The first has both the volume and the margin headroom to justify optimisation investment.
Do not optimise listings in isolation from your margin data. A high-traffic listing with a gross margin below 10% may not generate meaningful profit even if conversion doubles. Always combine your Lazada product report data with your actual landed cost and platform fee data before deciding where to invest optimisation effort.
Connecting Lazada Data to Your Cross-Channel View
If you are selling the same SKU across Lazada, Shopee, Shopify and TikTok Shop, your Lazada traffic and conversion data has an additional use: benchmarking. If a product converts at 3.8% on Shopee but only 1.1% on Lazada, the product itself is not the problem — the listing execution or the channel fit is. This cross-channel comparison is one of the most powerful analytical moves available to multi-channel operators.
For example, a consumer electronics accessories brand operating across Shopee Malaysia and Lazada Malaysia might find that their cable range converts at 3.1% on Shopee but only 1.4% on Lazada for the same SKUs. After investigation, they discover that on Lazada, those listings lack the ‘Preferred Seller’ badge and have fewer than five ratings, while the Shopee listings have 200+ reviews each. The fix is not the product — it is the listing maturity on Lazada.
Tools like BrizoMarket are designed to surface exactly this kind of cross-channel comparison — pulling product performance data from multiple platforms into a single view so you can spot where the same SKU is underperforming on one channel relative to another. When your catalogue spans dozens of SKUs across four platforms, doing this manually in spreadsheets is time-consuming and error-prone.
What to Do After Identifying Your Problem Listings
Once you have your prioritised list, build a structured optimisation workflow. Assign each listing a diagnosis category from your analysis, then apply the relevant fix in a disciplined sequence. Avoid changing multiple variables on a listing simultaneously — if you update the price, images and title at the same time, you will not know which change improved conversion.
- Start with pricing: check competitor pricing for the top three search keywords driving traffic to the listing and adjust if you are more than 20% above median
- Fix the main image: ensure it is high resolution, white background where required, and shows the product clearly with no overlaid text that obscures the item
- Rewrite the title using the keyword that is actually driving traffic, not what you assume buyers search for
- Expand the description with specific product specifications, use-cases and what is included in the box
- Add a short product video if you have one — even a 15-second clip showing the product in use improves conversion in most categories
- Review fulfilment settings: enable Fulfilled by Lazada (FBL) if feasible, or ensure your self-ship lead time is competitive
- After 14 days, return to the Product Report and compare conversion rate — repeat for the next variable if needed
Tracking Progress and Measuring the Return
Set a 30-day review cadence for your conversion optimisation programme. Each month, re-run the same Product Performance Report export, re-calculate your traffic-conversion matrix, and identify whether last month’s ‘Conversion Problem’ listings have moved into the ‘Star Listings’ or ‘Hidden Gems’ quadrant.
Track two financial outcomes: the revenue generated by optimised listings in the 30 days after changes versus the 30 days before, and the change in ROAS for any Sponsored Solutions campaigns pointing to those listings. If you have fixed a genuine conversion problem, your advertising efficiency should improve because the same number of paid clicks now results in more orders.
For finance managers reporting on channel performance, this process also provides clean data for contribution margin analysis. As conversion improves, your advertising cost per order falls, which directly increases the contribution margin per unit on Lazada — without requiring any change to product cost or fulfilment structure.
Analyse Your Lazada Listings Alongside Every Other Channel
BrizoMarket helps e-commerce operators and finance managers track product performance, conversion rates and profitability across Lazada, Shopee, Shopify and TikTok Shop in one place — so you can stop switching between platforms to understand where your catalogue is underperforming.