How to Use TikTok Shop Search Analytics to Identify Which Keywords Drive the Highest Revenue per Click Across Your Catalogue
TikTok Shop has introduced a search-driven discovery layer that many sellers still treat as an afterthought. While most operators focus on video views and affiliate commissions, a quieter and often more profitable traffic source is building underneath: organic and paid search within TikTok Shop itself. Shoppers who use search have higher purchase intent than passive video viewers, and the keywords they type reveal exactly what they want to buy. The challenge is connecting those keywords back to revenue, margin, and catalogue performance — not just clicks.
This article walks through a practical framework for extracting revenue-per-click (RPC) data from TikTok Shop’s search analytics, mapping it back to your product catalogue, and using that data to make better decisions about which keywords to invest in, which products to promote, and where your search spend is leaking margin.
Why Revenue per Click Is the Right Search Metric for E-commerce
Most sellers optimise TikTok Shop search campaigns around cost-per-click (CPC) or click-through rate (CTR). Both metrics are incomplete. A keyword with a low CPC might convert at 0.5% and produce thin margins, while a keyword with a higher CPC converts at 4% and drives your highest-margin SKUs. Revenue per click cuts through that noise.
Revenue per click is calculated as total revenue generated from a keyword divided by the total clicks that keyword produced over the same period. It collapses conversion rate and average order value into a single number that tells you how much each visitor from that keyword is actually worth to your business.
| Total revenue from keyword 'vitamin c serum' (30 days) | SGD 4,800 |
| Total clicks from that keyword (30 days) | 1,200 clicks |
| Revenue per Click (RPC) | SGD 4.00 per click |
Once you know RPC, you can benchmark it against your cost-per-click to calculate whether a paid search placement is profitable before you scale it. If your CPC on ‘vitamin c serum’ is SGD 1.20 and your gross margin on the products that keyword converts on is 55% (yielding SGD 2.20 in gross profit per click), you have a viable search investment. If CPC climbs to SGD 3.80, ad spend consumes 95% of the revenue per click, plunging you into significant losses before factoring in product costs, fulfilment, returns, or platform commissions.
Where to Find Search Analytics Inside TikTok Shop Seller Centre
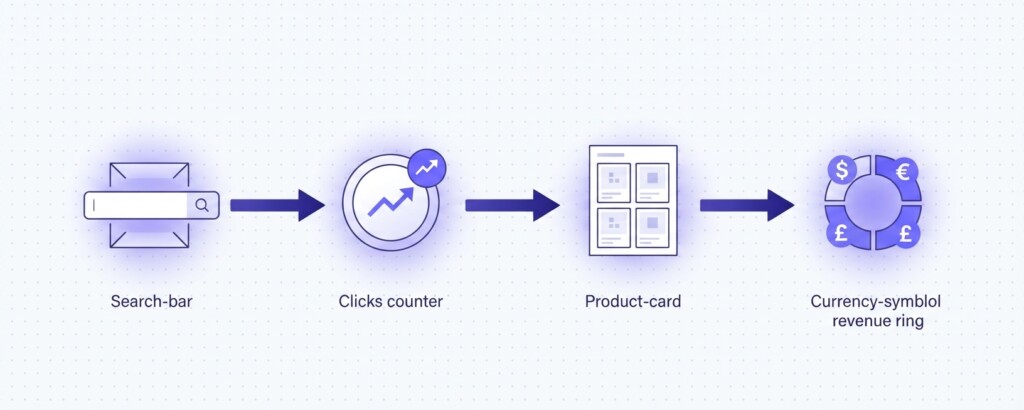
TikTok Shop Seller Centre provides search data across two primary areas: the Analytics dashboard (Data Compass) within Seller Centre, and Search Ads reporting within TikTok Ads Manager if you are running paid placements. For organic search, navigate to Analytics → Shop Tab & search (or Data Compass → Search Analytics → Store Keyword). This view shows you which search terms shoppers used to discover your products, the click volume per term, and the resulting orders and revenue attributed to those search entry points.
For paid search, TikTok Shop Search Ads (now part of the broader Shopping Ads suite) provide keyword-level reporting including impressions, clicks, spend, conversions, and attributed revenue. Download this at the keyword level for the same date range as your organic data so you can compare the two side by side.
Pull at least 60 days of data before drawing conclusions. TikTok Shop search behaviour has strong weekend and campaign-period spikes, particularly around platform-wide sale events. A 30-day window that captures a major promotion will skew your RPC figures upward and lead to over-investment in keywords that only convert during discounting periods.
Building a Keyword-to-Product Revenue Map
Raw keyword data from TikTok Shop tells you which terms generated traffic and orders. What it does not automatically tell you is which specific products in your catalogue were purchased as a result. This is the mapping step that most sellers skip — and skipping it means you cannot calculate true margin per keyword.
The practical approach is to export your keyword report alongside your product-level sales report for the same period, then match orders by SKU to identify which products are most commonly purchased by visitors entering through each keyword. For sellers with catalogues under 500 SKUs, this can be done in a spreadsheet. For larger catalogues, you need a tool that connects traffic source data to product-level order data at the transaction level.
- Export the search performance report from Seller Centre (under Shop Tab & search or Search Analytics, including clicks, orders, and revenue per keyword).
- Export the Product Sales report for the same date range (include SKU, units sold, revenue, and your internal cost of goods).
- In TikTok Ads Manager, export keyword-level Search Ad performance if running paid placements.
- Create a working spreadsheet with one row per keyword, adding columns for: total clicks, total orders, conversion rate, revenue, average order value, estimated CPC spend (if paid), and gross margin of the top-converting product.
- Calculate RPC for each keyword: Revenue ÷ Clicks.
- Calculate Gross Profit per Click: (Revenue × Gross Margin %) ÷ Clicks.
- Sort descending by Gross Profit per Click to identify your highest-value search terms.
A Worked Example: Skincare Brand Across TikTok Shop and Shopify
Consider a skincare brand selling on both TikTok Shop and Shopify, with the same core catalogue across both channels. On TikTok Shop, they run Search Ads on eight keyword clusters. After exporting 60 days of data and mapping keywords to products, their keyword performance table looks like this:
| Keyword | Clicks | Revenue (SGD) | RPC (SGD) | Avg Order Value | Conv. Rate | Gross Margin | GP per Click |
|---|---|---|---|---|---|---|---|
| niacinamide serum | 3,200 | 22,400 | 7.00 | 140 | 5.0% | 62% | 4.34 |
| vitamin c brightening | 2,800 | 16,800 | 6.00 | 120 | 5.0% | 58% | 3.48 |
| sunscreen spf 50 | 4,100 | 16,400 | 4.00 | 82 | 4.9% | 41% | 1.64 |
| face wash gentle | 3,600 | 10,800 | 3.00 | 72 | 4.2% | 48% | 1.44 |
| moisturiser oily skin | 1,900 | 13,300 | 7.00 | 175 | 4.0% | 65% | 4.55 |
| anti-ageing cream | 1,200 | 9,600 | 8.00 | 160 | 5.0% | 60% | 4.80 |
| toner alcohol free | 2,500 | 7,500 | 3.00 | 75 | 4.0% | 44% | 1.32 |
| eye cream dark circles | 900 | 7,200 | 8.00 | 180 | 4.4% | 66% | 5.28 |
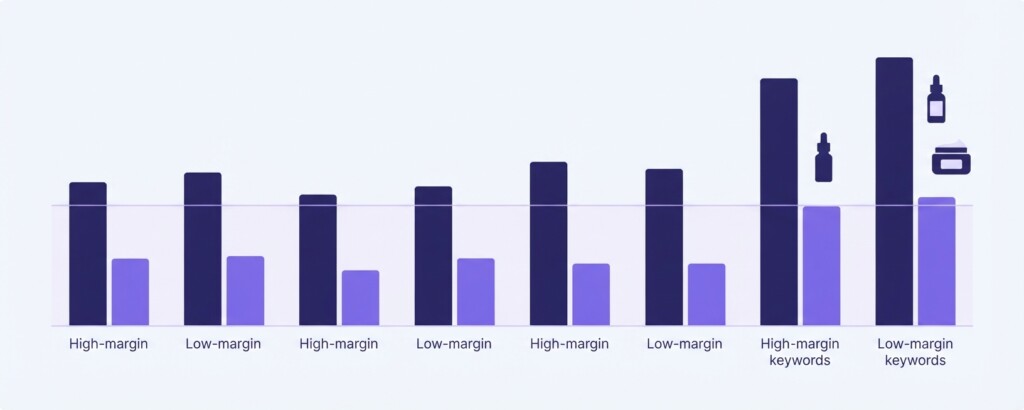
The table immediately reveals that ‘sunscreen spf 50’ and ‘face wash gentle’ generate the most absolute clicks but deliver the lowest gross profit per click — primarily because those products carry lower margins. ‘Eye cream dark circles’ and ‘anti-ageing cream’ generate fewer clicks but are your most profitable search terms per visitor. If the brand is allocating paid search budget evenly across all eight keywords, it is subsidising low-margin traffic at the expense of high-margin categories.
Comparing TikTok Shop Search Performance Against Other Channels
If you sell the same SKUs on Shopee or Lazada, their search advertising platforms provide similar keyword-level reports. Running the same RPC and gross-profit-per-click analysis across channels lets you understand where your search spend is working hardest. A keyword like ‘niacinamide serum’ might generate SGD 7.00 RPC on TikTok Shop but only SGD 4.50 RPC on Shopee for the same SKU, suggesting TikTok Shop shoppers searching for that term are more valuable — either because they convert at a higher rate or because they purchase larger baskets.
This cross-channel view is also important when you are deciding where to invest in inventory depth. If a keyword cluster consistently drives high RPC and healthy gross profit per click on TikTok Shop, that is a signal to ensure stock availability is prioritised for those SKUs on that channel — running out of stock on a high-RPC keyword forfeits revenue that is not easily recovered.
Do not conflate attributed revenue in TikTok Shop reporting with actual deposited revenue. TikTok Shop attributes revenue to the click that most recently preceded purchase, which can overstate the contribution of certain keywords if shoppers have interacted with video or affiliate content in the same session. Cross-check your attributed revenue totals against your actual settlement amounts from Seller Centre to ensure your margin calculations are based on real cash received, not platform-side attribution estimates.
Using RPC Data to Adjust Bids and Budget Allocation
Once you have gross profit per click by keyword, setting rational bid limits becomes straightforward. Your maximum defensible CPC for any keyword is the gross profit that click generates, minus an acceptable contribution margin buffer. If ‘eye cream dark circles’ generates SGD 5.28 gross profit per click and you want to retain at least SGD 2.00 of contribution margin after ad spend, your maximum bid should not exceed SGD 3.28.
| Gross Profit per Click — 'eye cream dark circles' | SGD 5.28 |
| Target Contribution Margin per Click (after ad spend) | SGD 2.00 |
| Maximum Defensible CPC | SGD 3.28 |
For keywords like ‘toner alcohol free’ where gross profit per click is only SGD 1.32, any CPC above SGD 1.00 leaves almost no contribution margin. These keywords may still have organic value, but paid investment should be minimal or paused unless you can demonstrate that toner purchases reliably lead to higher-margin repurchase behaviour that the platform-side attribution does not capture.
Identifying Catalogue Gaps from Search Data
TikTok Shop’s search data also shows you terms that generated impressions but resulted in low or zero purchases — often because the best-matching product in your catalogue did not satisfy the search intent, was out of stock, or was priced uncompetitively. Terms with high impression volume and low click-to-order conversion deserve a catalogue audit: are your product titles and images aligned with what the shopper expects when they type that phrase? Is the landing product priced within range of what similar search terms convert at on Shopee or Lazada?
For multi-channel operators, tools like BrizoMarket can help connect cross-channel product performance data so you can see how the same SKU performs across TikTok Shop, Shopify, Lazada, and Shopee in one view — making it easier to spot where a keyword opportunity on one platform corresponds to a proven product that is already converting well elsewhere in your catalogue.
A Practical Monthly Review Checklist
- Export 60-day keyword and product sales data from TikTok Shop Seller Centre and Ads Manager.
- Calculate RPC and gross profit per click for every keyword with more than 200 clicks.
- Identify your top five keywords by gross profit per click — confirm these have adequate stock depth.
- Identify keywords where actual CPC exceeds your maximum defensible bid — reduce or pause bids.
- Flag high-impression, low-conversion keywords for product listing audits (titles, images, pricing).
- Compare RPC for the same keyword clusters on Shopee and Lazada to identify channel-specific value.
- Adjust campaign budgets to weight spend toward high-GP-per-click keyword clusters.
- Review again after any platform-wide sale event using a clean 30-day post-event window.
The Core Takeaway
TikTok Shop search is not simply a traffic channel — it is a margin management tool when you read it correctly. Most sellers look at which keywords drive the most clicks or the most revenue in absolute terms. The operators who consistently extract profit from TikTok Shop search are those who map keywords to product-level margins, calculate gross profit per click rather than just revenue per click, and set bid ceilings based on what each keyword actually earns after cost of goods. The analysis is not complex, but it requires discipline to run regularly and willingness to pause spending on high-volume, low-margin keywords even when the absolute revenue numbers look impressive.
Start with 60 days of data, build the keyword-to-product mapping once, and you will have a decision framework you can update monthly in under two hours. The insights it surfaces — which keywords to scale, which to pause, and which catalogue gaps to fill — will compound across every future campaign you run.
Analyse Your TikTok Shop Search Performance Alongside Every Other Channel
BrizoMarket helps multi-channel e-commerce operators connect product, revenue, and margin data across TikTok Shop, Shopify, Lazada, and Shopee — so you can compare keyword and channel performance without manually stitching spreadsheets together each month.