How to Build a Multi-Channel Dashboard That Shows Blended CAC and LTV by Platform

If you are selling across Shopify, Shopee, Lazada and TikTok Shop simultaneously, you already know the pain: every platform gives you its own analytics, its own definitions and its own version of what success looks like. The problem is that none of those dashboards talk to each other. You end up with a fragmented picture of your business where you cannot answer the most important questions — which platform is actually profitable, which customers are worth acquiring and where your marketing budget should go next month.
Building a unified multi-channel dashboard that shows blended Customer Acquisition Cost (CAC) and Lifetime Value (LTV) by platform is one of the highest-leverage analytical projects an e-commerce operator can undertake. This article walks you through exactly how to do it — from structuring your data to calculating the right metrics to making channel-level decisions with confidence.
Why Platform-Native Analytics Are Not Enough
Each marketplace and storefront measures performance in ways that serve its own interests. TikTok Shop attributes conversions to its own ads ecosystem. Lazada reports ‘confirmed orders’ differently from shipped or settled revenue. Shopee shows you Gross Merchandise Value (GMV) but buries commission fees and promotional subsidies in separate reports. Shopify gives you solid storefront data but has no visibility into what happens on your marketplace listings.
When you only look at each channel in isolation, you are making decisions based on incomplete information. A channel might look profitable on its own dashboard while quietly destroying margin when you account for platform fees, returns, fulfilment costs and the ad spend needed to drive traffic to it.
The goal of a multi-channel dashboard is not to replicate what each platform already shows you. It is to build a single source of truth that lets you compare channels on equal terms — using consistent definitions for revenue, cost, CAC and LTV.
Step 1 — Define Your Revenue and Cost Layers Consistently
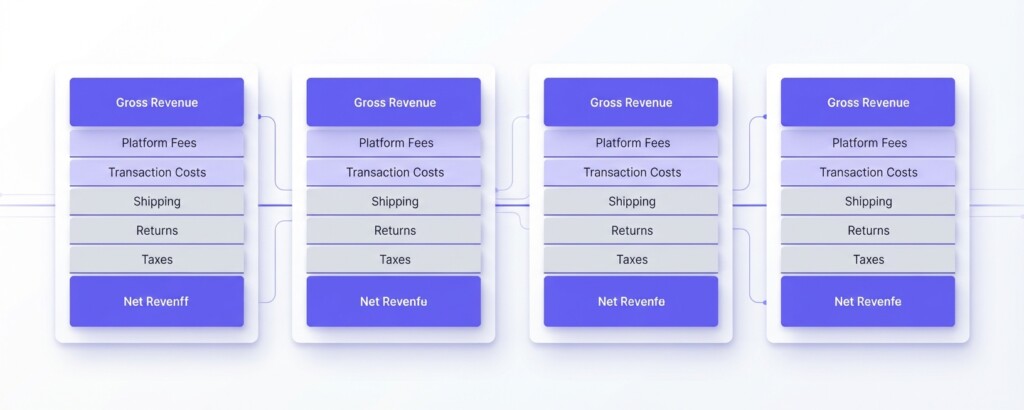
Before you can calculate CAC or LTV meaningfully, you need to agree on what ‘revenue’ means across every channel. The safest definition is Net Revenue: the amount that actually settles into your bank account after platform commissions, payment processing fees, voucher subsidies and returns.
Here is a practical framework showing how gross revenue differs from net revenue across common channels:
| Channel | Gross Revenue | Platform Commission | Promo Subsidy | Payment Fee | Net Revenue |
|---|---|---|---|---|---|
| Shopify (DTC) | $10,000 | 0% | $0 | ~2.5% | ~$9,750 |
| Shopee | $10,000 | ~5.5% | $300 | ~1.5% | ~$9,000 |
| Lazada | $10,000 | ~6% | $600 | ~1.5% | ~$8,650 |
| TikTok Shop | $10,000 | ~5% | $400 | ~1.5% | ~$8,950 |
These numbers are illustrative, but the principle is critical: if you compare Shopify at $10,000 GMV to Lazada at $10,000 GMV and conclude they perform equally, you are ignoring a $1,100 difference in what actually lands in your account. Every metric downstream of revenue — including LTV — will be distorted if you skip this step.
Step 2 — Calculate CAC Correctly for Each Channel
Customer Acquisition Cost is the total amount you spend to acquire one new customer on a given channel. The formula sounds simple, but the inputs are where most operators go wrong.
| Total Paid Ad Spend (channel-specific) | $4,000 |
| Platform Promotional Contributions (vouchers, flash sale fees) | $600 |
| Agency or In-House Marketing Labour (allocated) | $400 |
| Total Acquisition Spend | $5,000 |
| New Customers Acquired in Period | 250 |
| CAC | $20.00 per customer |
The common mistake is including returning customer orders in the denominator. CAC measures the cost to acquire a new customer, not the average cost across all orders. If you mix new and repeat buyers, your CAC looks artificially low and your LTV:CAC ratio will be misleading.
For marketplace channels like Shopee and Lazada, ‘new customers’ can be harder to define because you do not own the customer relationship. A practical proxy is first-time buyers from your specific store on that platform during the measurement period — most seller centre dashboards provide this figure.
On TikTok Shop, ad spend and organic content-driven sales are often difficult to separate cleanly. If a viral video drives purchases, the CAC on those orders is effectively zero — but that should not be averaged into your paid CAC figure without flagging it separately. Blending paid and organic acquisition in one CAC number will distort your media buying decisions.
Step 3 — Calculate LTV by Channel With Realistic Cohort Data
Lifetime Value is the total net revenue (or contribution margin, if you want a more useful version) that a customer generates over their relationship with your business. The most practical way to calculate this for a growing e-commerce business is a simple cohort-based model.
Start with customers acquired in a specific month, then track how much revenue they generate over the next 3, 6 and 12 months. Do this separately for each channel. Over time you will see materially different retention patterns by platform.
For example, a DTC Shopify customer who found your brand through search or referral may have significantly higher repeat purchase rates than a Shopee customer who was primarily motivated by a flash sale discount. The Shopee customer may have a lower LTV even if they had an identical first-order value.
| Channel | Avg. First Order Value (Net) | 12-Month Repeat Revenue (Avg.) | 12-Month LTV | CAC | LTV:CAC Ratio |
|---|---|---|---|---|---|
| Shopify (DTC) | $65 | $82 | $147 | $28 | 5.25x |
| Shopee | $48 | $31 | $79 | $18 | 4.39x |
| Lazada | $52 | $22 | $74 | $22 | 3.36x |
| TikTok Shop | $44 | $18 | $62 | $14 | 4.43x |
Based on this example, Shopify DTC has the strongest LTV:CAC ratio despite the highest CAC. TikTok Shop has a low CAC but also a low LTV — customers may be impulse buyers who rarely return. Lazada shows the weakest ratio, suggesting that acquisition costs are not justified by repeat purchase behaviour.
Step 4 — Build the Blended Dashboard Structure
A practical multi-channel dashboard does not need to be built by a data engineering team. Many e-commerce operators run effective versions inside Google Sheets or Looker Studio, pulling data from exports or connector tools. What matters is consistency in structure.
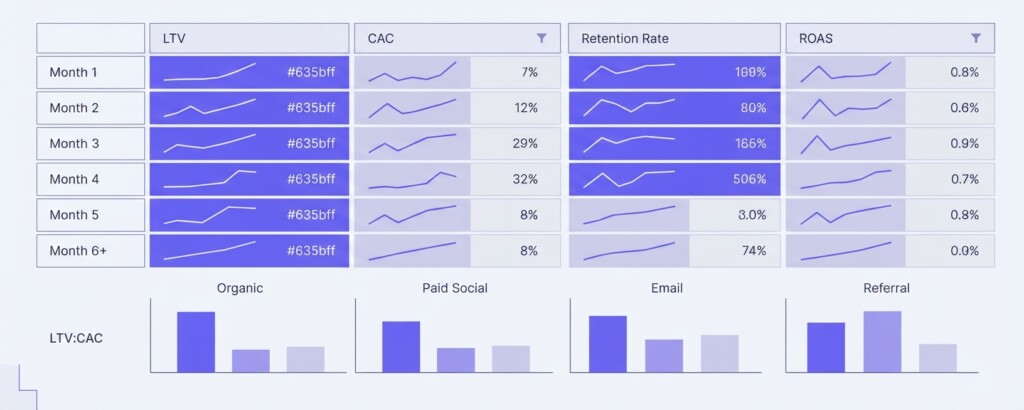
Your dashboard should have two layers. The first is the Channel Performance Layer — showing each platform side-by-side with consistent metrics. The second is the Business-Level Blended View — aggregating across all channels to give you a total picture.
- Pull net revenue by channel monthly (after fees, returns and subsidies)
- Attribute all marketing spend to the channel it was spent on, including labour and agency costs
- Identify new customers vs. returning customers by channel using order data or platform seller reports
- Calculate CAC per channel using only new customer counts in the denominator
- Build cohort tables tracking 3-month, 6-month and 12-month LTV by acquisition channel
- Add contribution margin per channel (net revenue minus COGS, fulfilment, platform fees)
- Combine into a blended summary row showing total CAC, weighted LTV and overall LTV:CAC
Step 5 — Add Contribution Margin to Make LTV Actionable
Raw revenue-based LTV is useful for direction, but contribution margin-based LTV is what actually tells you whether a customer relationship is financially viable. Contribution margin strips out the variable costs directly associated with each order: cost of goods sold, packaging, fulfilment, platform fees and returns.
If your Shopee customers generate $79 in 12-month revenue but you spend $48 in COGS and fulfilment serving them, the contribution margin LTV is only $31. If your CAC was $18, you have a $13 contribution margin surplus — which needs to cover fixed overhead before generating profit. That is a very thin margin and should inform how aggressively you invest in Shopee acquisition.
Use contribution margin LTV rather than revenue LTV when making budget allocation decisions. Revenue-based LTV overstates the true economic value of a customer if your gross margins vary significantly across channels or product categories.
How to Use the Dashboard to Make Channel Decisions
Once your dashboard is running with at least three months of consistent data, you have a genuine tool for capital allocation. Here are the practical decisions it should inform:
- Increase ad spend on channels where LTV:CAC exceeds 4x and contribution margin is healthy
- Reduce or restructure spend on channels where LTV:CAC is below 3x or declining over cohorts
- Investigate channels with high GMV but low net revenue — platform fees or subsidies may be eroding margins silently
- Prioritise retention investment (email, loyalty, re-engagement) on channels where first-order contribution margin is strong but repeat purchase rates are low
- Use TikTok Shop to drive awareness and first purchase, then migrate high-value customers toward Shopify DTC for improved margin on repeat orders
Where Tools Like BrizoMarket Fit In
The most time-consuming part of building this dashboard is not the analysis — it is the data collection and normalisation. Pulling separate exports from Shopify, Shopee Seller Centre, Lazada Seller Centre and TikTok Shop, then reconciling them into a consistent format, can easily consume several hours per week.
Tools like BrizoMarket are designed specifically for multi-channel e-commerce operators who need this kind of unified view without building a custom data pipeline. Rather than stitching together spreadsheets manually, you can connect your channels and have the platform surface blended performance metrics — including contribution margin and channel-level profitability — in a structured way that supports the CAC and LTV analysis described in this article.
Common Mistakes to Avoid
Do not calculate blended CAC across all channels as a single number without first understanding per-channel CAC. A low blended CAC might disguise the fact that one channel has an extremely high CAC that a low-cost channel is masking. You need per-channel visibility before you can trust the blended figure.
- Mixing GMV with net revenue when comparing channel performance
- Including repeat orders in CAC calculations instead of using only new customer counts
- Using revenue-based LTV without accounting for variable costs and returns
- Treating platform-reported ‘advertising ROAS’ as equivalent to true channel profitability
- Skipping cohort analysis and using a single average LTV figure across all acquisition periods
- Failing to account for return rates, which vary significantly across marketplaces
Practical Next Steps
Start small and build incrementally. You do not need a perfect dashboard on day one. Begin by pulling last quarter’s data from each channel, defining net revenue consistently and calculating CAC using only new customer counts. Even a rough first pass will surface meaningful differences between your channels that your current reporting is hiding.
Once you have a working version, commit to updating it monthly and looking at three-month rolling trends rather than reacting to single-month noise. LTV in particular requires patience — you need at least six months of cohort data before the numbers become reliable enough to drive significant budget decisions.
The operators who build this discipline early are the ones who can scale confidently — because they know exactly what a new customer is worth on each platform before they spend to acquire them.
Get a Unified View of Your Multi-Channel Performance
BrizoMarket helps e-commerce operators connect their Shopify, Shopee, Lazada and TikTok Shop data to track blended CAC, LTV and contribution margin by channel — without manual spreadsheet work.