How to Track Return Rate by Channel and Calculate Its True Impact on Net Margin
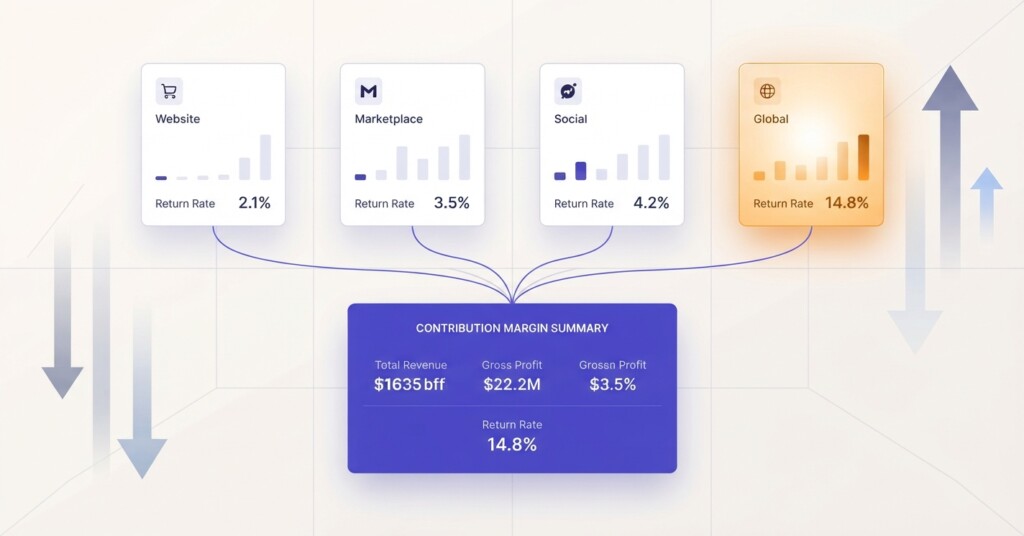
Returns are one of the most misunderstood costs in e-commerce. Most operators know their overall return rate, but very few track it by channel — and fewer still calculate what returns are actually doing to their net margin. If you are selling across Shopify, Shopee, Lazada and TikTok Shop simultaneously, your return rate is almost certainly different on each platform, and so is the true cost of each return.
This article walks through how to measure return rate by channel accurately, how to calculate the full financial impact of returns on net margin, and how to use that analysis to make smarter decisions about where you sell, what you promote, and how you price.
Why Channel-Level Return Tracking Matters
A blended return rate across all channels hides the truth. A 12% blended return rate sounds manageable. But if your Shopify DTC store runs at 6%, your Shopee store at 9%, your Lazada store at 14%, and your TikTok Shop at 22%, you are looking at four completely different profitability profiles — and only one of them may actually be generating positive contribution margin after returns are factored in.
The reason return rates vary by channel comes down to customer intent, content quality and fulfilment experience. TikTok Shop customers often purchase impulsively after watching a short video. They are more likely to have mismatched expectations about the product. Lazada and Shopee run frequent discount campaigns that attract price-sensitive buyers who return items more readily. Your Shopify store, by contrast, typically attracts customers who have spent more time on your product pages and are more intentional in their purchase.
Step One: Define What You Are Measuring
Before pulling numbers, align on your definition of ‘return rate.’ There are three common ways to measure it, and mixing them produces inconsistent data.
- Unit Return Rate: Units returned divided by units shipped. Best for operations and logistics.
- Order Return Rate: Orders with at least one returned item divided by total orders shipped. Useful for understanding customer behaviour.
- Revenue Return Rate: Gross returned revenue divided by gross shipped revenue. Most relevant for financial analysis and margin calculations.
For margin analysis, use Revenue Return Rate. It tells you directly what proportion of your gross revenue is being clawed back before you even calculate costs. Use Unit Return Rate alongside it to understand operational load on your warehouse or 3PL.
Step Two: Pull Return Data by Channel
Each platform stores return data differently. Shopify tracks refunds and returns natively in its Orders and Reports section. Shopee and Lazada both have seller centre dashboards with return and refund reports, though they require manual export in many markets. TikTok Shop provides order-level return data in its Seller Center under the ‘Manage Returns’ or ‘Returns & Refunds’ section.
The challenge is that none of these systems speak to each other by default. You need to consolidate this data into a single view, either via a spreadsheet model updated weekly or through an analytics platform that connects to multiple sales channels. The goal is a table that shows, for each channel: gross revenue, returned revenue, net revenue, number of orders, number of returned orders, and the revenue return rate.
| Channel | Gross Revenue | Returned Revenue | Net Revenue | Revenue Return Rate |
|---|---|---|---|---|
| Shopify DTC | $48,200 | $2,892 | $45,308 | 6.0% |
| Shopee | $31,500 | $2,835 | $28,665 | 9.0% |
| Lazada | $22,800 | $3,192 | $19,608 | 14.0% |
| TikTok Shop | $17,600 | $3,872 | $13,728 | 22.0% |
| Total | $120,100 | $12,791 | $107,309 | 10.7% |
In this example, the blended return rate of 10.7% looks acceptable. But TikTok Shop is surrendering 22 cents of every dollar earned — before platform fees, fulfilment costs or cost of goods are deducted. That changes the profitability conversation entirely.
Step Three: Calculate the True Cost of a Return
Most operators count only the refunded revenue when thinking about return costs. That significantly understates the damage. A return does not just reverse a sale — it consumes resources on both the outbound and inbound side of your operation.
To calculate the true cost of a single return, you need to add together all the costs associated with that transaction from sale to restocking.
| Original outbound shipping cost (not recovered) | $4.50 |
| Return shipping cost (paid by seller) | $4.50 |
| Labour: processing and inspection | $2.00 |
| Repackaging materials | $0.80 |
| Platform return handling fee (Lazada example) | $1.20 |
| Lost gross margin on original sale (35% margin on $28 item) | $9.80 |
| Estimated damage or unsellable rate (20% of item value) | $5.60 |
| True Total Cost Per Return | $28.40 |
For a $28 item with a $9.80 gross margin, a single return costs $28.40 in total. You have not just lost the sale — you have gone negative by $18.60 on that transaction. This is why high return rates on lower-priced SKUs are so damaging and why channel-level visibility is non-negotiable.
While platform commission fees on Shopee, Lazada and TikTok Shop are generally refunded or reversed when an order is returned, payment processing and transaction fees (typically 2–3%) are usually non-refundable. Certain platforms also retain return administration charges or unrecoverable shipping costs. Always include these non-refundable fees in your return cost calculation — they are frequently overlooked and add directly to your net cost per return.
Step Four: Recalculate Contribution Margin After Returns
Once you know the revenue return rate and the true cost per return, you can build a channel-level contribution margin model that reflects reality rather than your gross sales figures.
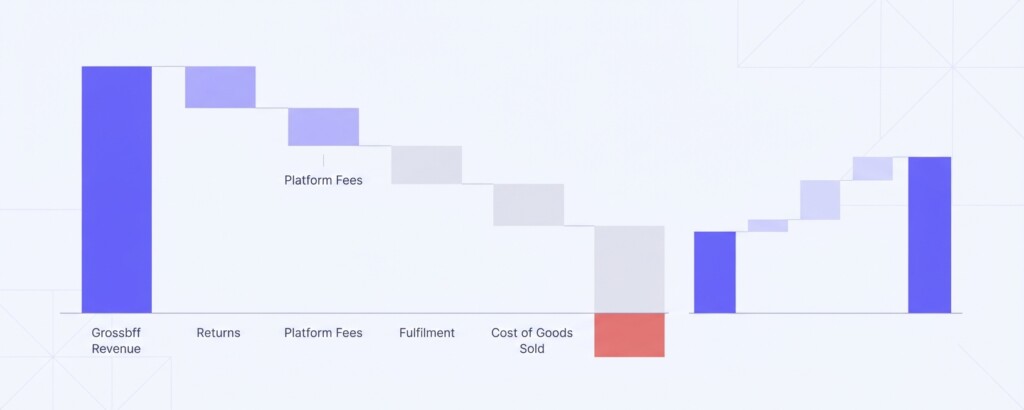
Take TikTok Shop in the example above. Gross revenue of $17,600 looks meaningful. But once you strip back returns, platform fees, fulfilment costs and the cost of goods, the picture changes sharply.
| Metric | Shopify DTC | TikTok Shop |
|---|---|---|
| Gross Revenue | $48,200 | $17,600 |
| Less: Returned Revenue | -$2,892 | -$3,872 |
| Net Revenue | $45,308 | $13,728 |
| Less: COGS (55% of gross) | -$26,510 | -$9,680 |
| Less: Platform Fees (2% Shopify / 8% TikTok) | -$964 | -$1,408 |
| Less: Return Processing Costs | -$1,040 | -$1,394 |
| Less: Fulfilment & Shipping (net of returns) | -$4,200 | -$2,100 |
| Contribution Margin | $12,594 | -$854 |
| Contribution Margin % | 26.1% | -4.9% |
TikTok Shop, which appeared to contribute $17,600 in revenue, is actually running at a negative contribution margin of -4.9% once returns are properly costed. Every sale made on that channel this month cost the business money. Shopify DTC, by contrast, is delivering a 26.1% contribution margin — more than five times better in efficiency terms.
Step Five: Diagnose Why Return Rates Differ by Channel
Knowing that TikTok Shop has a 22% return rate is actionable only if you understand why. Return rate drivers fall into three categories: product-side issues, content and expectation issues, and fulfilment issues.
- Product fit and sizing issues: Most common in apparel and footwear. Check if your size guide is clearly shown in product content on each channel.
- Content gap between expectation and reality: Short-form video on TikTok Shop often omits product specifications. Buyers who cannot find detailed information before buying are more likely to return after.
- Incorrect items shipped: A fulfilment accuracy problem, not a channel problem. Check pick-and-pack error rates by warehouse or 3PL.
- Fraudulent or policy-abuse returns: More common on platforms with lenient return policies. Review your return reason codes to quantify this.
- Damage in transit: A packaging or carrier issue. Cross-reference return reasons with shipping carrier data.
Pull your return reason data from each platform’s seller centre and categorise it. If 60% of TikTok Shop returns cite ‘item not as described,’ the fix is content — not pricing or logistics. If Lazada returns spike after promotional events, you may be attracting buyers who are gaming a discount rather than genuinely wanting the product.
Building a Return Rate Monitoring Routine
Return rate analysis should not be a quarterly exercise. It needs to be part of your weekly or bi-weekly channel performance review. The metrics to track on a rolling basis are: revenue return rate by channel, top returned SKUs by channel, return reason distribution, and contribution margin after returns by channel.
If you are managing multiple channels manually, a structured spreadsheet model can work — but it becomes fragile as order volumes grow. Tools that connect directly to your Shopify, Shopee, Lazada and TikTok Shop accounts and consolidate this data automatically reduce the risk of missing a return rate spike before it becomes a margin problem. BrizoMarket is built specifically for this kind of multi-channel profitability analysis, pulling channel-level sales, return and cost data into a single view so operators can see contribution margin by channel without building complex manual models.
When to Consider Restricting a Channel or SKU
Not every channel deserves equal investment. If a channel consistently delivers a negative contribution margin after returns — even after you have addressed content and fulfilment issues — it is worth questioning whether continued presence on that channel is rational.
Similarly, if a specific SKU has a return rate above 25% on any channel, that product is almost certainly unprofitable on that channel regardless of its gross sales volume. The decision to de-list a SKU from a high-return channel, or to restrict it to channels where return rates are lower, is a legitimate margin management strategy — not a defeat.
A useful benchmark: a SKU becomes unprofitable on returns alone when the total net cost per return exceeds the margin generated by retained units. Do not conflate returned revenue with lost profit: for a SKU with a 30% gross margin, a 30% return rate will wipe out your margin pool if the fully burdened cost of each return (including unrecoverable freight and damaged stock) approaches the item’s retail value — leaving you to fund operational overhead out of pocket.
Practical Next Steps
- Export return and refund data from each channel (Shopify, Shopee, Lazada, TikTok Shop) for the last 90 days.
- Calculate revenue return rate by channel and compare it to your blended rate.
- Estimate the true cost per return for your average order value, including shipping, handling, non-recoverable platform fees and margin loss.
- Build a channel-level contribution margin model that deducts returns, COGS, platform fees and fulfilment.
- Identify your top three returned SKUs on each channel and pull return reason codes.
- Set a monthly return rate threshold per channel (for example, flag any channel exceeding 15% revenue return rate for immediate review).
- Review product content on high-return channels to close expectation gaps before assuming the product or channel is unviable.
Returns are not just an operational inconvenience — they are a margin lever. The operators who track return rates at the channel and SKU level, and who calculate the true financial cost of each return, make fundamentally better decisions about where to invest their marketing budget, which products to push in campaigns, and which channels are genuinely worth the effort. Start with the data you already have and build from there.
Track Return Rates and Contribution Margin Across Every Channel
BrizoMarket connects your Shopify, Shopee, Lazada and TikTok Shop data to give you a clear view of return rates, costs and channel profitability — without manual spreadsheet work.