How to Allocate Shared Warehouse and Fulfillment Costs Across Multiple Sales Channels

When you run an e-commerce business across Shopify, Shopee, Lazada and TikTok Shop simultaneously, your warehouse and fulfillment operations serve all of those channels from the same physical space, the same staff and often the same inventory. The problem is that most accounting systems record those costs as a single pool, making it almost impossible to know which channel is actually profitable and which is quietly destroying your margins.
Shared fulfillment costs — warehouse rent, picker-packer wages, packaging materials, inbound freight, outbound courier fees and returns handling — can represent 15% to 30% of revenue for many multi-channel operators. If you allocate them incorrectly, or not at all, you will consistently misread your channel-level profitability and make poor decisions about where to invest your growth budget.
This article explains the main allocation methods, walks through a realistic worked example and shows you how to build a channel profitability view that reflects the true cost of serving each platform.
Why Shared Cost Allocation Matters for Channel Profitability
Consider a business selling the same skincare product on four channels. Each channel has a different price point, different platform fees and a very different order profile. Shopify orders might average three units per order, while TikTok Shop flash sales generate hundreds of single-unit orders in a short window. Lazada might have a high return rate during promotional periods. If you assign the same per-order fulfillment cost to all four channels, you will systematically undercharge high-volume, low-value channels and overcharge low-volume, high-value ones.
The goal of cost allocation is not accounting precision for its own sake. It is to give you an accurate channel contribution margin so you can make better decisions about pricing, promotions, platform investment and whether to expand or pull back on a given channel.
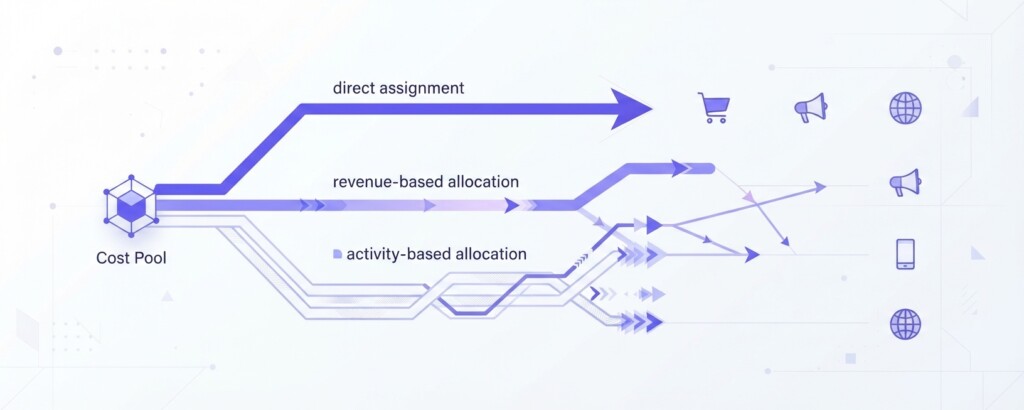
The Three Main Allocation Methods
There is no single universally correct method. The right approach depends on your business model, your cost structure and the data you can actually collect. Most multi-channel operators should use a combination of direct assignment and one of the two driver-based methods below.
- Direct Assignment: Costs that can be traced to a specific channel are assigned directly. Channel-specific courier contracts, platform-specific packaging inserts and dedicated returns processing staff are examples. This is the most accurate method and should always be used before any allocation method is applied to the residual shared pool.
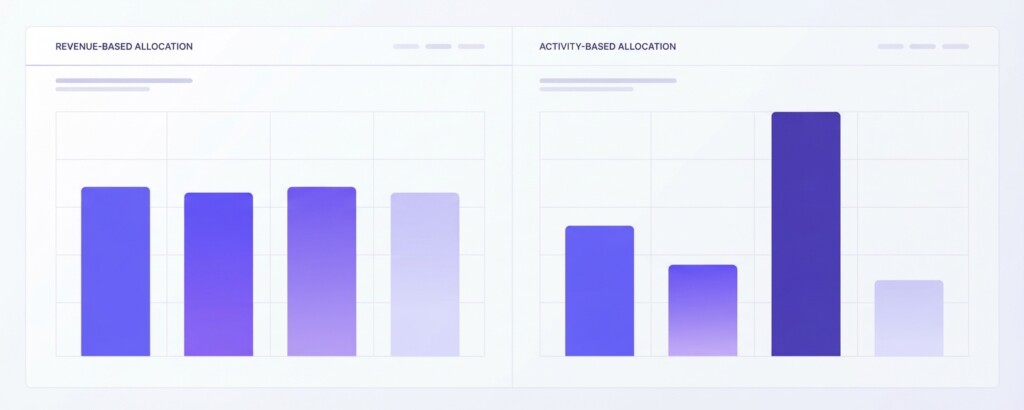
- Revenue-Based Allocation: The remaining shared costs are split in proportion to each channel’s share of total revenue. This is simple to calculate but tends to penalise high-revenue channels and reward high-volume, low-value ones. It works acceptably when order profiles are similar across channels.
- Activity-Based Allocation (Cost Driver Method): Shared costs are split based on measurable operational drivers such as number of orders processed, number of units picked, or number of returns handled. This is more complex but far more accurate when channels have meaningfully different order sizes, SKU mixes or return rates.
Building Your Cost Pool: What Counts as a Shared Fulfillment Cost
Before allocating anything, you need to define exactly what sits inside your shared cost pool. Costs that belong here are those which your operation cannot cleanly assign to a single channel because they support all channels collectively.
| Cost Category | Typical Cost Type | Usually Direct or Shared? |
|---|---|---|
| Warehouse rent & utilities | Fixed monthly | Shared |
| Warehouse management software | Fixed monthly | Shared |
| Picker-packer wages | Variable by volume | Shared |
| Packaging materials (generic) | Variable by order | Shared |
| Inbound freight from supplier | Variable by shipment | Shared |
| Outbound courier (platform-agnostic) | Variable by order | Shared |
| Returns processing | Variable by returns | Shared |
| Platform-specific inserts or branded boxes | Variable | Direct to channel |
| Lazada or Shopee fulfillment fees (3PL) | Variable | Direct to channel |
| TikTok Shop live sale prep labour | Variable | Direct to channel |
Worked Example: A Four-Channel Skincare Business
Imagine a business with monthly revenue of $120,000 spread across Shopify ($45,000), Shopee ($30,000), Lazada ($25,000) and TikTok Shop ($20,000). Their shared warehouse and fulfillment cost pool after direct assignments is $18,000 per month. Here is how the two main methods produce different results.
Method 1 — Revenue-Based Allocation: Each channel receives a share of the $18,000 pool proportional to its revenue contribution.
| Shopify share (37.5% of $18,000) | $6,750 |
| Shopee share (25% of $18,000) | $4,500 |
| Lazada share (20.8% of $18,000) | $3,744 |
| TikTok Shop share (16.7% of $18,000) | $3,006 |
| Total allocated | $18,000 |
Method 2 — Activity-Based Allocation using order count: Suppose Shopify processes 600 orders, Shopee 900, Lazada 400 and TikTok Shop 1,200 — a total of 3,100 orders. TikTok Shop drives flash sale volume with very small basket sizes. The cost per order is $18,000 ÷ 3,100 ≈ $5.8065 (approximately $5.81). Multiplying the exact rate by order count produces the following rounded figures (with a $1 rounding variance in the total):
| Shopify: 600 orders × ~$5.81 | $3,484 |
| Shopee: 900 orders × ~$5.81 | $5,226 |
| Lazada: 400 orders × ~$5.81 | $2,323 |
| TikTok Shop: 1,200 orders × ~$5.81 | $6,968 |
| Total allocated (*reflects rounding) | $18,001 |
The difference is significant. Under revenue-based allocation, TikTok Shop receives only $3,006 in shared fulfillment cost. Under activity-based allocation using order volume, it receives $6,968 — more than double. If your channel profitability report uses the revenue method, TikTok Shop will look far more profitable than it actually is.
Using revenue-based allocation for a channel like TikTok Shop — which typically generates high order counts but low average order values — will consistently overstate that channel’s contribution margin. Decisions made on that number, such as increasing ad spend or running deeper promotions, may be based on a profit figure that does not exist.
Choosing the Right Cost Driver for Your Business
Order count is the most commonly used driver and is appropriate when picking, packing and shipping effort is roughly equal per order regardless of size. But for many businesses, order count is not the best proxy. Here are the most useful drivers and when to use each.
| Cost Driver | Best Used When | Example |
|---|---|---|
| Order count | Order complexity is similar across channels | Same-size parcels, similar SKU mix per order |
| Units picked | Orders vary significantly in item count | Shopify bundles vs. single-unit TikTok orders |
| Parcel weight or volume | Courier cost is the dominant shared expense | Heavy goods, bulky SKUs |
| Return count | Returns processing is a major cost line | High return rate on Lazada promotional periods |
| Inbound freight units | Receiving and putaway costs are significant | High SKU variety, frequent supplier deliveries |
For most multi-channel operators, a blended approach works best. Use order count to allocate labour and packaging costs, and use parcel weight or volume to allocate courier and freight costs. This gives you a more granular and defensible result without requiring sophisticated software.
How to Calculate Channel Contribution Margin After Allocation
Once you have allocated shared costs, you can build a proper channel contribution margin statement. This is the number that tells you what each channel is genuinely contributing to covering your overhead and generating profit.
| Channel revenue | $20,000 |
| Less: Cost of goods sold (COGS) | -$9,000 |
| Gross profit | $11,000 |
| Less: Platform fees (e.g. TikTok Shop commission) | -$1,400 |
| Less: Channel marketing spend | -$1,200 |
| Less: Allocated shared fulfillment costs | -$6,968 |
| Channel contribution margin | $1,432 |
In this example, TikTok Shop delivers a contribution margin of only $1,432 on $20,000 of revenue — a 7.2% margin. That is a very thin cushion before accounting for any overhead beyond fulfillment. Compare this against Shopify, which on $45,000 of revenue with $3,484 in allocated fulfillment costs might deliver a 28% contribution margin. That comparison shapes every growth and investment decision.
Practical Steps to Implement This in Your Business
- Map your full fulfillment cost base for the last three months. Include every line item from rent and wages to packaging tape and returns labels.
- Separate direct costs from shared costs. If a cost is provably attributable to one channel, assign it directly. Only the residual enters your shared pool.
- Choose one or two cost drivers that reflect how your warehouse actually operates. Pull order count, unit count or parcel data from your warehouse management system or order management platform.
- Calculate your allocation rate. Divide the shared pool by the total driver volume to get a per-unit rate, then multiply by each channel’s driver volume.
- Build a channel contribution margin report. Deduct COGS, platform fees, channel marketing spend and allocated fulfillment costs from each channel’s revenue.
- Review and recalibrate quarterly. Channel mix, order profiles and cost structures shift over time. A static allocation model will drift out of accuracy within six months.
- Pressure-test with what-if scenarios. If you ran 50% more TikTok Shop volume next month, what would happen to your fulfillment cost and margin? Your model should be able to answer that.
Using Analytics Tools to Automate the Process
Doing this manually in a spreadsheet is viable when you have two or three channels and relatively stable volumes. As your channel mix grows and order profiles become more complex, the manual process becomes error-prone and time-consuming.
Tools that consolidate multi-channel order data — pulling from Shopify, Shopee, Lazada and TikTok Shop into a single view — make it significantly easier to track operational drivers like order count and units per channel in real time. BrizoMarket is designed specifically for this kind of multi-channel profitability analysis, allowing e-commerce operators to see channel-level contribution margins that account for platform fees, marketing costs and fulfillment allocations in one place, rather than stitching together four separate reports.
The underlying logic — choose your drivers, apply your rates, build your contribution margin view — remains exactly the same whether you do it in a spreadsheet or a dedicated platform. The difference is speed, accuracy and how quickly you can act on the numbers.
Key Takeaways
Shared warehouse and fulfillment costs are one of the most commonly mishandled line items in multi-channel e-commerce. Revenue-based allocation is easy but misleading. Activity-based allocation using order count, unit count or parcel data gives you a far more accurate picture of what each channel actually costs to serve.
The financial stakes are real. A channel that appears to generate a 20% margin under revenue-based allocation may be delivering only 7% or 8% under an accurate activity-based model. At that margin level, any increase in platform fees, courier costs or return rates pushes the channel into the red. Knowing that before you scale is the difference between profitable growth and an expensive mistake.
Start by mapping your cost base, separating direct from shared costs, selecting the right driver for your operation and building a simple allocation model. Run it alongside your existing reporting for 90 days. The differences you see between your old channel revenue numbers and your new contribution margin figures will tell you everything you need to know about where to focus next.
See Your True Channel Profitability Across Every Platform
BrizoMarket brings together your Shopify, Shopee, Lazada and TikTok Shop data into a single profitability view — with channel-level contribution margins that reflect your real fulfillment and platform costs.