How to Identify and Eliminate Your Least Profitable SKUs Across All Sales Channels
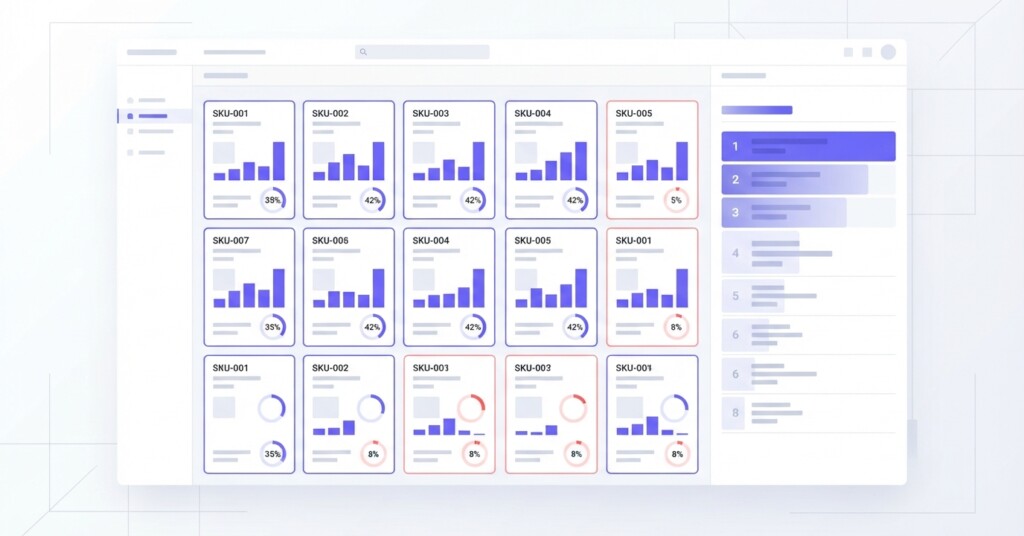
Not every product that sells well is actually making you money. Across Shopify, Shopee, Lazada and TikTok Shop, the fees, fulfilment costs and promotional discounts attached to each channel can quietly erode the margins on individual SKUs — sometimes turning apparent bestsellers into loss-makers. If you are managing inventory across multiple sales channels without a clear view of per-SKU profitability by channel, you are almost certainly carrying products that cost you more to sell than they return.
This article walks through a structured approach to identifying your least profitable SKUs, calculating the true contribution margin of each product on each channel, and making defensible decisions about what to cut, reprice or renegotiate.
Why Volume and Revenue Are the Wrong Signals
Most ecommerce dashboards surface revenue and order count prominently. These are useful for spotting trends but dangerous as the primary lens for product decisions. A SKU that generates $10,000 in monthly revenue on Lazada might only return $400 in contribution margin after platform commission, fulfilment fees, COGS and the cost of vouchers that were needed to make it sell. Meanwhile, a quieter SKU on your Shopify store might generate $3,000 in revenue and $1,200 in contribution margin with no promotional spend.
The same logic applies in reverse. A product with a low return rate and fast inventory turnover might look unremarkable in revenue terms but carry strong contribution margins because its cost structure is lean. Revenue ranking masks this entirely.
Profitability analysis should always be done at the SKU level, broken down by channel. A product’s performance on TikTok Shop is not a useful proxy for how it performs on Shopee — fees, traffic costs, return rates and average selling prices can all differ significantly between platforms.
Building a True Cost Stack for Each SKU
Before you can rank your SKUs by profitability, you need a consistent cost model. The following cost stack applies to most multi-channel ecommerce operations. Work through it for each SKU and channel combination you want to evaluate.
| Average Selling Price (per unit, after discounts) | $28.00 |
| Less: Platform Commission (e.g. 5% on Shopee) | – $1.40 |
| Less: Payment Processing Fee (e.g. 2%) | – $0.56 |
| Less: Shipping Subsidy or Voucher Cost (if seller-funded) | – $1.80 |
| Less: Cost of Goods Sold (COGS) | – $11.00 |
| Less: Fulfilment & Packing Cost | – $2.50 |
| Less: Return Allowance (estimated return rate × net loss per return) | – $0.90 |
| Contribution Margin per Unit | $9.84 |
Once you have this per-unit contribution margin, multiply it by the units sold in your analysis period to get total contribution by SKU and channel. This is the number that actually matters — it tells you how much each product is contributing toward your fixed overheads and profit.

The SKU Profitability Audit: Step by Step
Run this audit monthly or at minimum quarterly. You need sales data, COGS data and a complete record of channel-specific fees for the period.
- Export your sales data by SKU and channel for the period (units sold, gross revenue, discount and voucher totals, returns).
- Pull your COGS per SKU from your inventory or accounting system. If COGS varies by batch, use a weighted average.
- Obtain the fee schedule for each platform — commission rates, payment fees, fulfilment or logistics fees where applicable.
- Calculate the net selling price per SKU per channel: gross revenue minus channel discounts and seller-funded vouchers.
- Subtract COGS to arrive at gross profit per unit, then deduct platform fees, payment processing fees and fulfilment costs.
- Apply your return rate adjustment: estimate the cost of returns (including reprocessing or write-offs) and deduct a per-unit allowance.
- Calculate contribution margin per unit and total contribution for the period.
- Rank all SKU-channel combinations from highest to lowest total contribution.
- Flag any SKU-channel combination with a contribution margin below 15% (or your own threshold) for further review.
- Identify SKUs that are negative-contribution in all channels — these are candidates for immediate removal.
A Practical Example: Comparing One SKU Across Four Channels
Consider a skincare brand selling a moisturiser (SKU: SKN-044) across Shopify, Shopee, Lazada and TikTok Shop. The product carries a COGS of $9.50 and the same fulfilment cost of $2.20 regardless of channel. Here is how the economics differ by platform over one month, with 200 units sold per channel.
| Metric | Shopify | Shopee | Lazada | TikTok Shop |
|---|---|---|---|---|
| Avg. Selling Price | $35.00 | $29.00 | $27.50 | $26.00 |
| Platform Commission | $0.00 | $1.45 (5%) | $2.75 (10%) | $2.08 (8%) |
| Payment Fee | $1.05 (3%) | $0.58 (2%) | $0.55 (2%) | $0.52 (2%) |
| Voucher / Promo Cost | $1.00 | $3.50 | $2.00 | $4.00 |
| COGS | $9.50 | $9.50 | $9.50 | $9.50 |
| Fulfilment Cost | $2.20 | $2.20 | $2.20 | $2.20 |
| Return Allowance | $0.50 | $0.80 | $0.70 | $1.20 |
| Contribution / Unit | $20.75 | $10.97 | $9.80 | $6.50 |
| Total Contribution (200 units) | $4,150 | $2,194 | $1,960 | $1,300 |
The same product generates more than three times the contribution on Shopify compared to TikTok Shop per unit sold. If you were optimising purely for revenue you might push volume on TikTok Shop because it has reach — but every unit you sell there is generating a fraction of what you earn through your own store. The decision to continue, reduce or exit a channel for this SKU should be driven by this comparison, not by raw sales numbers.
Be careful not to exit a channel based on a single SKU’s performance. Some channels justify lower per-unit margins because they drive new customer acquisition or enable you to clear slow-moving inventory. The point is to make the decision intentionally, with full cost visibility, not by default.
What to Do With Your Least Profitable SKUs
Once you have ranked your SKU-channel combinations by contribution margin, you will typically find your products fall into three categories. Handle each differently.
The first category is SKUs that are loss-making or near-breakeven on a specific channel. These may be profitable elsewhere, but the channel-specific cost structure — particularly heavy voucher dependency or high commission rates — makes them unviable on that platform. The practical options are: raise the listed price on that channel, withdraw the SKU from channel promotions, or remove it from that channel’s catalogue altogether while continuing to sell it where it performs.
The second category is SKUs that are loss-making across all channels. These require a harder decision. Before removing them, check whether the COGS can be reduced through renegotiation with suppliers, whether the product can be bundled with a higher-margin item to raise average order value, or whether the pricing has simply been set too low to recover costs. If none of those paths are viable, discontinuing the SKU frees up working capital, warehouse space and operational bandwidth.
The third category is SKUs with low margin but high strategic value — for example, a product that drives repeat purchases or bundles well. These should be tracked closely but may be worth retaining if the customer lifetime value justification is clear and documented.

Using Data Systems to Sustain the Analysis
Doing this audit manually in spreadsheets once is useful. Doing it continuously across hundreds of SKUs and four or more channels is not practical without purpose-built tooling. The challenge is that each platform exports data in different formats, uses different fee structures and updates commission or logistics policies periodically. Reconciling all of that manually creates significant room for error.
This is the kind of problem that BrizoMarket is designed to solve — consolidating multi-channel sales data and applying cost logic to surface per-SKU contribution margins across platforms, so operators can run profitability reviews without rebuilding their spreadsheet model every month.
Whether you use a dedicated analytics platform or a well-maintained spreadsheet system, the discipline is the same: your cost model must be channel-specific, your review must be periodic, and the output must be actionable rankings rather than raw data exports.
Metrics to Track on an Ongoing Basis
- Contribution Margin per Unit: net selling price minus all variable costs including platform fees, COGS and fulfilment.
- Contribution Margin %: contribution margin per unit divided by net selling price — useful for cross-SKU comparison.
- Total Contribution by SKU-Channel: units sold multiplied by contribution margin per unit over the period.
- Return Rate by SKU and Channel: returns divided by units sold — high return rates destroy margin quickly.
- Promotional Spend as % of Revenue: the proportion of revenue absorbed by vouchers, discounts and free-shipping subsidies.
- Inventory Days on Hand: slow-moving SKUs carry storage costs that compound margin erosion.
- ROAS on Paid Traffic by SKU: where you are running channel-specific ads to drive product sales, return on ad spend must be factored into SKU-level profitability.
Common Mistakes to Avoid
The most common error is using blended averages. Averaging your platform commission across all channels hides the fact that a product might be viable on one channel and a liability on another. Always calculate at the SKU-channel level.
The second mistake is ignoring return costs. A product with a 20% return rate on TikTok Shop (common for fashion and lifestyle categories) carries a materially different cost structure than the same product with a 3% return rate on Shopify. Treat returns as a real cost, not a footnote.
The third mistake is treating this as a one-off exercise. Channel fee structures change. Your COGS changes. Promotional participation changes. A SKU that was marginally profitable six months ago may be loss-making today. Set a recurring calendar review — monthly for your top 20% of revenue SKUs, quarterly for the rest.
Practical Next Steps
Start with your top 30 SKUs by revenue. Build the cost stack for each one, broken down by channel. Rank them by contribution margin percentage. Identify anything below your floor threshold and decide on an action — reprice, restructure or remove. Document the decision and the rationale. Then extend the analysis to your full catalogue.
Most operators who run this exercise for the first time discover that 15–25% of their active SKU-channel combinations are not covering their variable costs. Removing or repricing those products does not shrink your business — it makes it more profitable with the same or fewer operational resources.
Get Full Visibility Into Your SKU Profitability Across Every Channel
BrizoMarket helps multi-channel ecommerce businesses consolidate their sales data, apply channel-specific cost structures and surface the contribution margins that drive better product and channel decisions.