How to Build a Channel-Level Contribution Margin Report That Separates Fixed Overheads from Variable Selling Costs
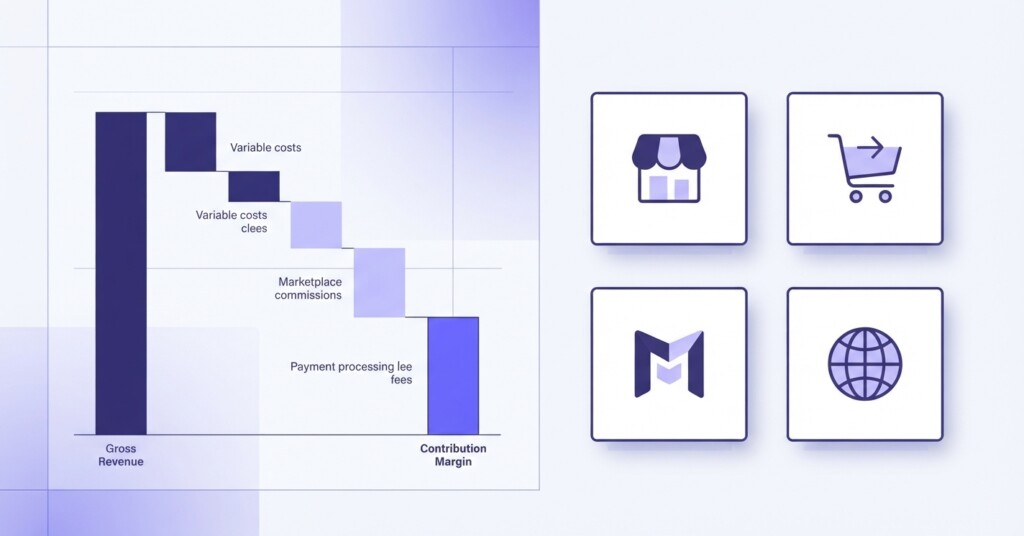
If you sell across Shopify, Shopee, Lazada and TikTok Shop simultaneously, you already know that blended revenue figures hide more than they reveal. A product might generate strong gross profit on your Shopify store and destroy value on Lazada once you account for platform fees, flash-sale discounts and last-mile fulfilment surcharges. The only way to see this clearly is to build a channel-level contribution margin report — one that isolates what each channel genuinely costs to operate, separate from the fixed overheads your business carries regardless of where a sale happens.
This article walks through how to structure that report, which costs belong where, how to calculate contribution margin at the channel level, and how to use the output to make better decisions about where to invest, where to pull back, and where to renegotiate.
Why Gross Profit Alone Does Not Tell the Full Channel Story
Gross profit — revenue minus the cost of goods sold — is a necessary starting point, but it stops well short of capturing what each sales channel actually costs you. Platform commissions, payment processing fees, channel-specific promotions, inbound fulfilment routing and performance advertising are all real costs tied directly to a channel. None of them appear in your gross margin calculation unless you deliberately put them there.
The practical consequence is that many multi-channel operators believe they are profitable across all channels when they are actually subsidising weaker channels with the margin generated by stronger ones. A contribution margin report forces that cross-subsidy into the open.
Contribution margin at the channel level answers a specific question: if you closed this channel tomorrow, how much of your cost base would actually disappear? The costs that disappear are variable and channel-specific. The costs that remain are fixed overheads — and they should not be used to judge a channel’s standalone performance.
The Core Framework: Two Cost Tiers
The structural discipline of a contribution margin report is the separation of costs into two tiers before you reach a net profit figure.
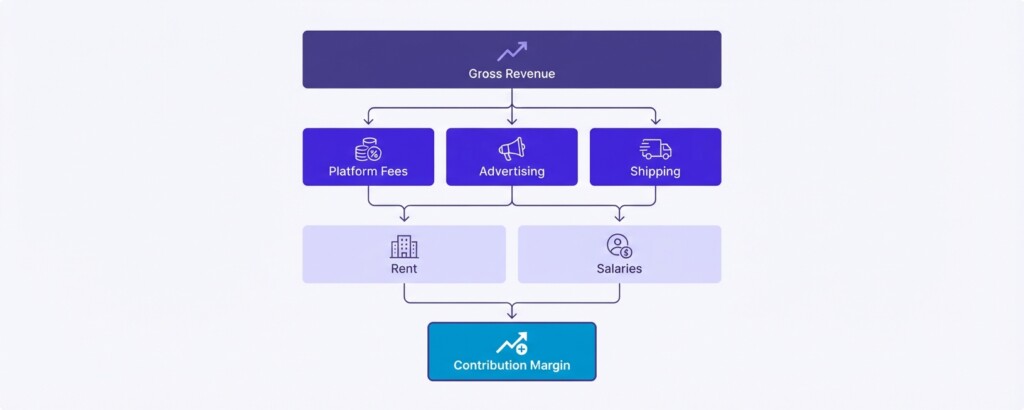
Tier 1 costs are directly variable with channel activity. They only exist because a sale happened on that specific channel. Tier 2 costs are fixed or semi-fixed overheads that the business incurs regardless of which channel generates revenue — warehouse rent, management salaries, technology subscriptions, finance and accounting.
Contribution margin is what remains after Tier 1 costs are subtracted from channel revenue. That number is the channel’s genuine contribution toward covering Tier 2 overheads and generating net profit. It is the right metric for comparing channels because it reflects what each channel actually adds to — or subtracts from — the business.
Which Costs Belong in Each Tier
Getting the cost classification right is the most important step. Misclassifying a cost overstates or understates channel contribution margin and leads to wrong decisions.
| Cost Item | Tier 1 — Variable (Channel-Specific) | Tier 2 — Fixed Overhead |
|---|---|---|
| Platform commission (Shopee, Lazada, TikTok Shop) | Yes | No |
| Payment processing fee (Shopify Payments, PayPal) | Yes | No |
| Channel advertising spend (Meta Ads for Shopify, Lazada Sponsored) | Yes | No |
| Seller-funded promotional discounts and vouchers on the channel | Yes | No |
| Outbound shipping cost paid per order | Yes | No |
| Returns processing cost per unit | Yes | No |
| Cost of goods sold | Yes | No |
| Warehouse rent and utilities | No | Yes |
| Warehouse staff salaries (fixed headcount) | No | Yes |
| ERP or OMS platform subscription | No | Yes |
| Finance and management salaries | No | Yes |
| Brand marketing (not tied to one channel) | No | Yes |
One area that requires judgement is fulfilment labour when your warehouse team handles variable picking and packing volumes. If you employ a fixed headcount, the labour cost is largely fixed even if order volume changes. If you use a third-party fulfilment provider and pay per order, that cost is genuinely variable and belongs in Tier 1. Apply the same logic test to every line: does this cost go to zero if this channel goes to zero?
Building the Report: A Step-by-Step Structure
Set up one column per channel. If you run Shopify as a direct-to-consumer store, Shopee, Lazada and TikTok Shop, you have four channel columns plus a consolidated total. The rows follow this sequence:
- Start with gross channel revenue — the total value of orders placed on each channel before any deductions.
- Subtract returns and refunds to arrive at net revenue. Pull this figure directly from each platform’s seller centre or your order management system.
- Subtract cost of goods sold for units sold on that channel. If you carry shared inventory, allocate COGS by units sold per channel using your weighted average cost.
- This gives you gross profit per channel. Calculate gross margin percentage as a sanity check before proceeding.
- Subtract all Tier 1 variable selling costs: platform commission, payment fees, channel advertising, seller-funded vouchers and discounts, and variable outbound shipping.
- The resulting figure is your channel contribution margin. Express it in absolute terms and as a percentage of net revenue.
- Below the contribution margin line, show total fixed overheads for the business. Do not allocate these to individual channels for the purpose of channel performance assessment — show them as a single shared cost pool.
- Net profit is total contribution margin across all channels minus total fixed overheads.
A Realistic Example Across Four Channels
Consider a mid-sized apparel brand selling across Shopify, Shopee, Lazada and TikTok Shop. The numbers below are illustrative but built to reflect realistic cost structures in Southeast Asian multi-channel commerce.
| Shopify — Net Revenue | $42,000 |
| Shopify — Cost of Goods Sold | -$16,800 |
| Shopify — Gross Profit | $25,200 |
| Shopify — Payment Processing (2.2%) | -$924 |
| Shopify — Paid Advertising (Meta/Google) | -$6,300 |
| Shopify — Outbound Shipping (subsidised) | -$2,100 |
| Shopify — Contribution Margin | $15,876 |
| Shopify — Contribution Margin % | 37.8% |
Now apply the same structure to Lazada, where platform commission sits at 5–8% depending on category, sponsored listings are charged separately, and flash-sale participation requires mandatory vouchers that are often co-funded but still carry a cost to the seller.
| Lazada — Net Revenue | $28,500 |
| Lazada — Cost of Goods Sold | -$11,400 |
| Lazada — Gross Profit | $17,100 |
| Lazada — Platform Commission (7%) | -$1,995 |
| Lazada — Sponsored Solutions Advertising | -$3,420 |
| Lazada — Vouchers and Promotions | -$1,710 |
| Lazada — Outbound Shipping | -$1,425 |
| Lazada — Contribution Margin | $8,550 |
| Lazada — Contribution Margin % | 30.0% |
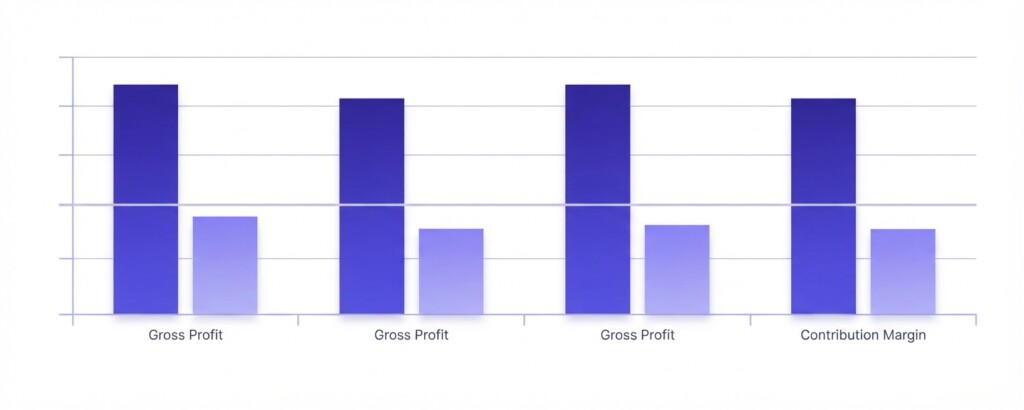
The gap between Shopify at 37.8% and Lazada at 30.0% contribution margin is meaningful. It does not necessarily mean Lazada should be closed — it may still be contributing absolute dollars toward fixed overheads — but it tells the commercial team they are working harder per dollar of Lazada revenue and need to either reduce variable costs or increase average order values on that channel.
Where TikTok Shop Changes the Calculation
TikTok Shop introduces costs that do not appear on traditional marketplace reports. Commission rates, affiliate creator payments, and live-selling production costs are all variable with TikTok Shop activity but require active effort to capture in your report.
Affiliate commission paid to creators — often 5–15% of GMV depending on your category and the creator tier — is a direct Tier 1 cost. If you run your own live sessions, any staff time, production equipment depreciation or studio hire that is solely for TikTok Shop activity can also be treated as a channel-specific variable cost. Many operators ignore these costs and overstate TikTok Shop contribution margin significantly.
If you pay creator affiliates through TikTok Shop’s affiliate programme, those fees appear in your TikTok Seller Centre reporting but are often excluded from the default ‘revenue minus COGS’ view inside spreadsheet-based P&L reports. Check your affiliate payout reports separately and add them explicitly to your Tier 1 cost stack for TikTok Shop. Failing to do this will cause you to overestimate how profitable the channel is.
Fixed Overhead Allocation: What Not to Do
A common mistake is to allocate fixed overheads to channels by revenue share and then declare that certain channels are ‘unprofitable.’ This approach creates the illusion of precision while producing distorted decisions.
If your warehouse rent is $8,000 per month regardless of channel mix, allocating $3,000 to Lazada because Lazada represents 37.5% of revenue does not make Lazada responsible for $3,000 of rent. If Lazada closed tomorrow, the rent would not fall by $3,000. Decisions made on this basis — cutting channels based on allocated overhead — often destroy contribution margin without reducing the overhead that was supposedly the problem.
The correct approach is to present fixed overheads as a single pool below the total contribution margin line. The business is profitable when total contribution margin across all channels exceeds total fixed overheads. Channel decisions should be based on whether a channel is generating positive contribution margin and whether the absolute contribution dollar is worth the management complexity required to run that channel.
Using the Report to Drive Decisions
Once you have contribution margin by channel, the report supports four practical decisions:
- Channel investment: Channels with the highest contribution margin percentage and strong volume growth are candidates for increased advertising or promotional investment. The marginal return on additional spend is better on a high-contribution-margin channel.
- Cost renegotiation: If a channel’s contribution margin is being compressed by platform fees or shipping costs, you have a quantified figure to bring to commercial conversations — whether that is with the marketplace, your logistics provider, or your 3PL.
- SKU and category mix: Some products carry higher variable selling costs on specific channels (bulky items with high shipping costs on Lazada, for example). Your contribution margin report can be extended to SKU level to identify which products to promote or suppress on which channels.
- Break-even analysis: With a clear view of fixed overheads and total contribution margin, you can calculate the revenue level each channel needs to reach before the overall business breaks even — useful for financial planning when launching a new channel or scaling into a new market.
Data Sources and Reporting Cadence
Building this report manually across four channels is time-consuming if you are pulling data from separate seller centres, reconciling ad platform exports and cross-referencing COGS from your inventory system. For operators at meaningful scale, the data infrastructure required to sustain a monthly contribution margin report is one of the core analytical challenges.
BrizoMarket is designed specifically for multi-channel ecommerce analytics — connecting channel revenue, platform fee data, advertising spend and product costs into a unified reporting view. Rather than assembling contribution margin reports from four different data exports, operators can analyse channel-level profitability in a consistent framework. This is particularly useful when TikTok Shop affiliate fees, Shopee vouchers and Lazada sponsored listings need to sit alongside Shopify payment processing costs in a single view.
Regardless of the tool you use, run this report monthly as a minimum. Quarterly is not frequent enough when platform commission rates change, shipping costs fluctuate seasonally, and advertising efficiency shifts with competitive pressure.
Practical Next Steps
Start with a single month of data. Map every cost line to either Tier 1 or Tier 2 using the classification logic above. Build the channel columns in a spreadsheet and calculate contribution margin for each channel. Then ask three questions: which channel has the highest absolute contribution, which has the highest percentage, and are any channels contribution-negative once all Tier 1 costs are included?
Those three questions, answered honestly with channel-level data, will surface more useful commercial insight than any blended revenue report you have been working with.
Analyse Your Channel Profitability in One Place
BrizoMarket helps multi-channel ecommerce operators build accurate contribution margin reports across Shopify, Shopee, Lazada, TikTok Shop and more — without manually reconciling data from four different seller centres.