How to Calculate the True Net Margin per Order After Packaging, Last-Mile Fees, and Payment Gateway Charges
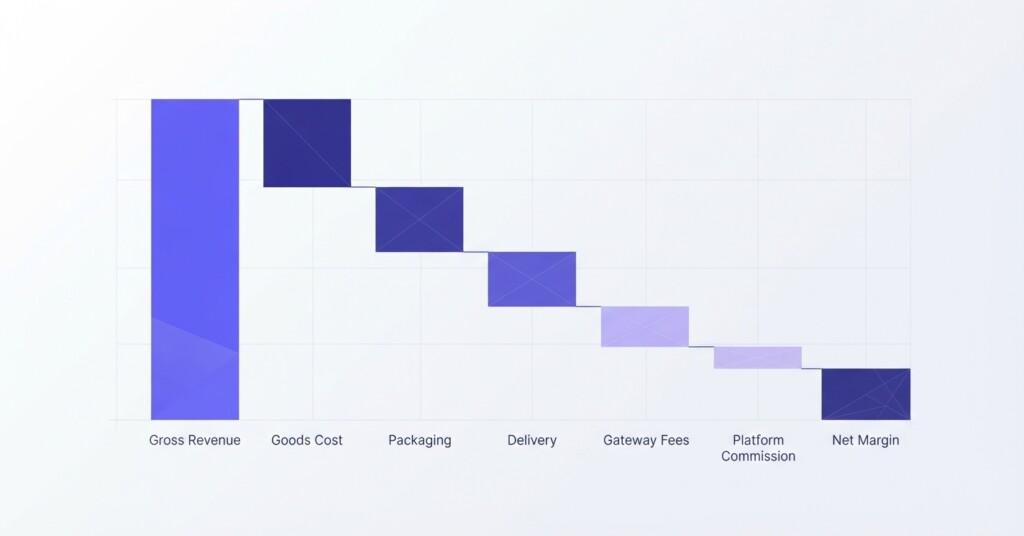
Most e-commerce operators know their gross margin. Far fewer know their true net margin per order — the figure that actually tells you whether each sale is contributing to your business or quietly eroding it. When you sell across Shopify, Shopee, Lazada, and TikTok Shop simultaneously, the problem compounds: each channel layers on its own commission structure, payment processing fees, and fulfilment costs, making it almost impossible to compare profitability at a glance.
This article walks through a structured method for calculating true net margin per order, channel by channel, so you can make informed decisions about where to invest, what to price, and which products are actually worth selling.
Why Gross Margin Alone Will Mislead You
Gross margin — revenue minus cost of goods sold — is useful, but it stops well short of telling you what a sale actually costs to fulfil and collect. Consider a product selling for $40 with a COGS of $16. That looks like a healthy 60% gross margin. But once you account for platform commission, payment gateway fees, packaging materials, and last-mile delivery, that $24 gross profit can shrink to $4 or even turn negative.
The businesses that grow profitably are the ones that measure at the order level, not just the product level. They understand contribution margin — what remains after all variable costs tied directly to fulfilling and collecting a single order — and they track it by channel.
Contribution margin per order = Gross revenue − COGS − Packaging − Last-mile delivery − Payment gateway fees − Platform commission. This is the number that tells you whether a channel is genuinely profitable before fixed overheads.
The Five Cost Layers You Must Account For
To calculate true net margin per order, you need to capture five distinct cost layers consistently across every channel you operate on.
- Cost of Goods Sold (COGS): The direct purchase or manufacturing cost of the item, including inbound freight allocated per unit.
- Packaging costs: Boxes, poly mailers, tissue paper, branded inserts, tape, and void fill — calculated per order or per unit depending on how your warehouse operates.
- Last-mile delivery fees: The charge to ship the parcel from your warehouse or fulfilment centre to the customer, including any fuel surcharges or remote area fees.
- Payment gateway charges: The percentage fee (and sometimes fixed per-transaction fee) taken by the payment processor or platform on the gross transaction value.
- Platform commission and fees: Marketplace commissions (Shopee, Lazada, TikTok Shop), transaction fees, and any mandatory service fees charged by the platform.
Each of these costs behaves differently across channels. On Shopify, you control the payment gateway and courier selection. On Shopee or Lazada, the platform may subsidise shipping for buyers but charge you a higher commission rate. On TikTok Shop, commission structures are evolving and vary by category. This asymmetry is exactly why a blended average across channels produces misleading results.

Building the Per-Order Calculation: A Worked Example
Let’s use a real-world scenario. You sell a skincare set at a retail price of $52. Your COGS is $18 per unit. You fulfil orders across Shopify, Shopee, and TikTok Shop. Here is how the per-order economics break down across each channel.
| Cost Component | Shopify | Shopee | TikTok Shop |
|---|---|---|---|
| Selling Price (Customer pays) | $52.00 | $52.00 | $52.00 |
| Platform Commission | $0.00 | $5.72 (11%) | $3.64 (7%) |
| Payment Gateway Fee | $1.81 (2.9% + $0.30) | $0.00 (included) | $1.04 (2%) |
| Net Revenue to Seller | $50.19 | $46.28 | $47.32 |
| COGS | $18.00 | $18.00 | $18.00 |
| Packaging | $1.20 | $1.20 | $1.20 |
| Last-Mile Delivery | $4.50 | $3.80 (subsidised rate) | $4.50 |
| Total Variable Costs | $23.70 | $23.00 | $23.70 |
| Contribution Margin ($) | $26.49 | $23.28 | $23.62 |
| Contribution Margin (%) | 50.9% | 44.8% | 45.4% |
Even at an identical selling price, Shopify delivers a contribution margin roughly six percentage points higher than Shopee in this scenario. That gap is driven by channel and platform fee structures — not product performance or customer demand.
The practical implication: if you are running equal-spend paid advertising across Shopify and Shopee, you need a significantly higher ROAS on Shopee just to match the profitability of a Shopify sale. Many operators miss this because they measure ROAS on ad spend alone without netting out channel-specific fulfilment costs.
How to Handle Packaging Costs Accurately
Packaging is often the most underestimated cost in per-order calculations. Operators frequently assign a flat estimate — say $1.00 per order — without accounting for how packaging cost varies by order size, product type, or SKU mix.
A more accurate approach is to calculate a weighted average packaging cost per order type. If 60% of your orders ship in a small poly mailer at $0.60 and 40% ship in a box at $1.80, your blended packaging cost is $1.08. For high-average-order-value brands with branded boxes and inserts, this figure can easily reach $2.50–$4.00 per order, which materially affects margin calculations.
| Small poly mailer (60% of orders × $0.60) | $0.36 |
| Standard box with insert (40% of orders × $1.80) | $0.72 |
| Weighted average packaging cost per order | $1.08 |
Review your packaging costs quarterly, particularly if your SKU mix shifts toward heavier or bulkier products, or if you introduce premium unboxing experiences for brand purposes. Branded packaging has a real cost that should appear in your per-order model, not be absorbed invisibly into overhead.
Last-Mile Delivery: The Variable That Breaks Most Averages
Last-mile delivery costs vary by weight, dimensions, destination zone, and courier. Using a single average delivery cost across your entire order volume will distort your margin calculations, particularly if you ship to a mix of metro and regional destinations.
A more reliable method is to calculate delivery cost as a percentage of average order value for each major shipping zone. For example, if your average order value is $52 and your average delivery cost is $4.50, that represents an 8.7% cost rate. If your delivery costs spike to $8.00 for remote areas, that rate jumps to 15.4% — nearly double — which may push certain orders into negative margin territory.
If you offer free shipping to customers, the delivery cost does not disappear — it transfers entirely to your margin. Free shipping on low-AOV orders is one of the most common causes of orders that appear profitable at the product level but destroy value at the contribution margin level.
On Shopee and Lazada, platform-subsidised shipping can reduce your effective last-mile cost per order, but this subsidy is often offset by higher commission rates. Always look at the total cost stack, not individual line items in isolation.

Payment Gateway Fees Across Channels
Payment gateway fees are straightforward on Shopify — typically a percentage plus a fixed fee per transaction, depending on your payment provider and Shopify plan. On marketplaces like Shopee, Lazada, and TikTok Shop, the platform handles payment processing directly and typically charges a mandatory transaction fee (commonly 2% to 3.27%) separate from or bundled into total platform seller deductions, which can make it feel invisible. But it is not free.
For Shopify stores using third-party gateways rather than Shopify Payments, there is an additional transaction fee on top of the gateway fee. If you are processing high volumes, the difference between payment configurations can represent a meaningful cost. For example, at $100,000 in monthly revenue, the difference between a 1.7% and a 2.2% gateway rate is $500 per month — or $6,000 per year.
Putting It Together: Your Per-Order Margin Checklist
- Pull your average selling price per channel (after any discounts, vouchers, or promotions applied).
- Subtract platform commission using the correct rate for each product category — rates differ by category on most marketplaces.
- Subtract payment gateway fees using your actual contractual rate, not an estimate.
- Assign COGS at the SKU level, including landed cost (inbound freight per unit).
- Calculate packaging cost using a weighted average based on your actual order mix.
- Apply last-mile delivery costs using zone-based averages, not a flat rate.
- Calculate contribution margin in both dollar terms and as a percentage of selling price.
- Flag any product-channel combinations where contribution margin falls below your minimum threshold (commonly set at 20–30% depending on business model).
Using Data Tools to Automate the Calculation
Doing this analysis manually in a spreadsheet is feasible for businesses running one or two channels with a small SKU range. As your channel count and product catalogue grow, manual reconciliation becomes error-prone and time-consuming.
This is where a purpose-built analytics tool that connects across your sales channels adds genuine value. BrizoMarket, for example, is designed for multi-channel e-commerce operators and pulls order-level data from Shopify, Shopee, Lazada, TikTok Shop, and other channels into a unified view. Rather than exporting reports from five different dashboards and reconciling them in Excel, you can see contribution margin by channel, by product, and by order — updated automatically.
The practical benefit is that you spend less time building the model and more time acting on what it tells you — whether that is repricing a product on a low-margin channel, renegotiating your courier contract, or redirecting ad spend toward the channel where your contribution margin is strongest.
What a Healthy Per-Order Margin Looks Like
There is no universal benchmark, but contribution margin per order below 30% of selling price should prompt a review, particularly if you are also carrying fixed costs for warehousing, staff, and marketing. For categories with high COGS — such as electronics accessories or consumables — contribution margins below 25% may be normal, but they leave very little room to absorb returns, refunds, or promotional discounts.
High-margin categories — skincare, fashion accessories, print-on-demand, and digital products — should be targeting contribution margins of 40–55% to support a sustainable marketing spend and business overhead. If your margins in these categories are compressed, the culprit is usually platform commission rates, aggressive free-shipping policies, or packaging costs that have crept up over time without review.
Practical Next Steps
Start by selecting your top 10 SKUs by revenue and running the full five-layer cost calculation for each one, across each channel you sell on. You will likely find that two or three product-channel combinations are performing well below expectation, and that one or two channels are significantly more profitable than you assumed.
From there, set a minimum contribution margin threshold for your business — a floor below which you will not run paid advertising for a given product or channel combination. This single discipline, applied consistently, prevents the common pattern of scaling ad spend on channels that look good on ROAS but are actually margin-negative when all fulfilment costs are included.
Review your per-order margin model at least quarterly, and rebuild it whenever you change courier contracts, introduce new packaging, renegotiate platform terms, or adjust your pricing strategy. These numbers are not static, and decisions made on outdated cost data are often worse than decisions made with no data at all.
See Your True Margin Across Every Channel
BrizoMarket connects your Shopify, Shopee, Lazada, and TikTok Shop data into a single analytics view — so you can track contribution margin, channel profitability, and order-level costs without building another spreadsheet.