How to Calculate True Channel Profitability Across Amazon, Shopify, and Wholesale
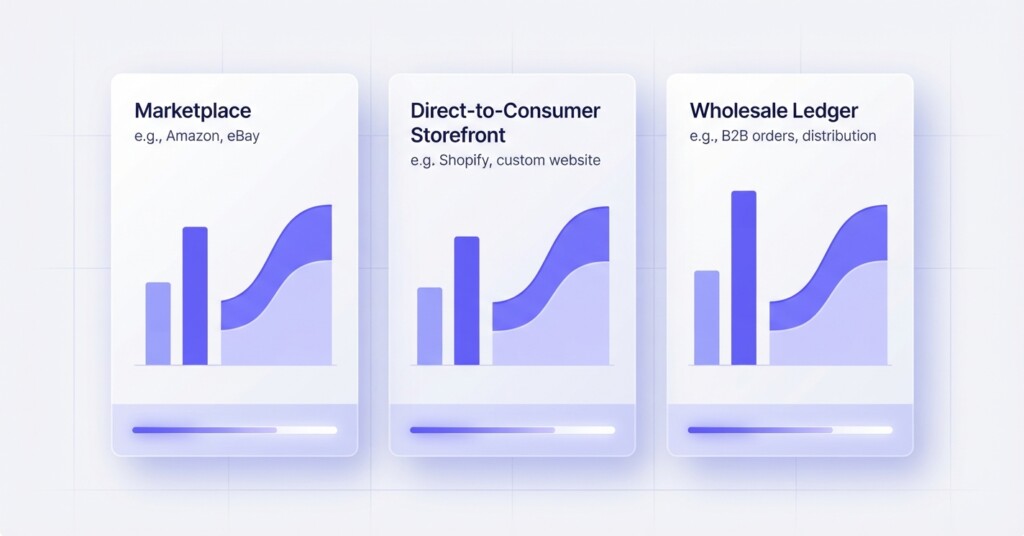
Most e-commerce businesses know their total revenue. Far fewer know which of their sales channels is actually making them money. Selling across Amazon, Shopify, and wholesale simultaneously creates a profitability illusion — channels that look healthy at the top line can quietly destroy margin once you account for every cost layer. This article walks through a practical framework for calculating true channel profitability, so you can make informed decisions about where to invest, where to pull back, and which channels deserve your best inventory.
Why Revenue Alone Will Mislead You
Consider a business selling a skincare set with a retail price of $60. In a given month, it generates $30,000 from Amazon, $20,000 from its own Shopify store, and $15,000 from a wholesale account. Total revenue: $65,000. On paper, Amazon looks like the star. But once you deduct the referral fees, fulfilment costs, advertising spend, and returns specific to each channel, the picture changes dramatically.
True channel profitability means calculating contribution margin at the channel level — not just gross margin. Contribution margin accounts for all variable costs directly attributable to a channel, leaving you with the real dollars that channel contributes to covering your fixed overhead and generating profit.
Contribution margin per channel = Net Revenue − Cost of Goods Sold − Channel-Specific Variable Costs. This is the number that tells you whether a channel is worth running.
Step 1 — Map Every Cost to the Correct Channel
The first discipline is cost attribution. Every channel carries a distinct cost structure, and mixing them into a blended P&L hides where money is being lost. Start by listing every variable cost category and assigning it to the channel that generates it.
For Amazon, the direct cost layer is significant. A typical product in a competitive category might attract a 15% referral fee, plus fulfilment fees through FBA that vary by size and weight. Add storage fees, return processing charges, and the cost of Sponsored Products advertising. A product selling at $60 on Amazon might see $9 in referral fees, $8.50 in FBA fulfilment, $2 in storage and returns, and $6 in advertising — totalling $25.50 in channel costs before you even deduct the cost of the product itself.
Shopify carries a different but equally real cost profile. Payment processing typically runs around 2.9% plus a fixed transaction fee. Shipping is usually borne by the seller for free-shipping offers. Marketing costs — paid social, email platform fees, influencer fees — are often concentrated here. Customer service and packaging upgrades also tend to be higher for DTC orders.
Wholesale appears deceptively simple but has hidden costs: trade terms that extend payment by 30–60 days, volume discounts that reduce effective selling price, freight and logistics costs, broker commissions, and the cost of chargebacks or compliance fines from larger retail buyers. The gross margin looks lower because the selling price is lower, but some of these operational costs may also be lower than DTC.

Step 2 — Build a Channel P&L Template
The most effective way to see channel profitability clearly is to build a simple P&L for each channel using the same structure. Below is a worked example for the $60 skincare set, using the monthly figures from our opening scenario. COGS for this product is $12 per unit.
| Metric | Amazon | Shopify | Wholesale |
|---|---|---|---|
| Gross Revenue | $30,000 | $20,000 | $15,000 |
| Units Sold | 500 | 333 | 500 |
| Effective Selling Price | $60.00 | $60.00 | $30.00 |
| COGS (at $12/unit) | $6,000 | $3,996 | $6,000 |
| Gross Profit | $24,000 | $16,004 | $9,000 |
| Gross Margin % | 80% | 80% | 60% |
| Referral / Platform Fees | $4,500 | $580 | $0 |
| Fulfilment / Shipping | $4,250 | $2,000 | $1,500 |
| Advertising / Marketing | $3,000 | $4,000 | $500 |
| Returns & Chargebacks | $600 | $400 | $300 |
| Other Channel Costs | $400 | $300 | $200 |
| Total Channel Costs | $12,750 | $7,280 | $2,500 |
| Contribution Margin $ | $11,250 | $8,724 | $6,500 |
| Contribution Margin % | 37.5% | 43.6% | 43.3% |
The table reveals something important. Amazon generates the most revenue and the highest absolute contribution dollars — but its contribution margin percentage is the lowest of the three channels. Shopify and wholesale are both more efficient on a per-dollar basis. If Amazon advertising costs increase or referral fees are adjusted, that channel could quickly become the worst performer rather than the best.
Beware of judging channels on gross margin alone. A wholesale channel at 60% gross margin and 43% contribution margin can outperform an Amazon channel at 80% gross margin and 37% contribution margin — because the cost to sell matters as much as the cost to make.
Step 3 — Calculate Return on Ad Spend by Channel
Advertising distorts channel performance more than any other variable. ROAS (Return on Ad Spend) is a useful starting metric, but it does not tell you whether the advertising is actually profitable. A channel-level ROAS of 4x sounds strong, but if your gross margin on that channel is only 35%, a 4x ROAS may still be losing money after other costs.
A more useful metric is ‘break-even ROAS’ — the minimum ROAS required to cover all variable costs. The formula is:
| Break-Even ROAS | 1 ÷ Contribution Margin % (excluding ad spend) |
| Example: Shopify channel contribution margin ex-ads = 63.6% | 1 ÷ 0.636 = 1.57x break-even ROAS |
| Example: Amazon channel contribution margin ex-ads = 47.5% | 1 ÷ 0.475 = 2.11x break-even ROAS |
| Actual Shopify ROAS | 5.0x (well above break-even) |
| Actual Amazon ROAS | 2.5x (marginally above break-even) |
In this scenario, Shopify advertising is generating genuinely profitable returns. Amazon advertising is technically above break-even, but there is very little buffer. A modest drop in conversion rate or a seasonal cost increase could push it into negative territory. This is the kind of insight that channel-level analysis surfaces — and that blended reporting obscures.
Step 4 — Adjust for Product Mix Effects
Channel profitability is not just about the channel structure — it is also about which products sell on each channel. If your Amazon channel is dominated by lower-margin products because those are the ones winning the Buy Box, while your Shopify store sells higher-margin bundles, the profitability gap between channels will be partly a product mix issue, not purely a fee structure issue.
To isolate the true channel effect, calculate contribution margin for the same product sold across multiple channels. Take your best-selling product and run the numbers on all three channels for that single SKU. If the same product produces 43% contribution margin on Shopify and 31% on Amazon, you have isolated the channel cost differential independent of product mix.
This analysis often produces difficult but necessary decisions. Some products are structurally unsuited to certain channels. A low-cost, high-volume product may work well on Shopify or wholesale but erode rapidly on Amazon once fees and advertising are applied. Knowing this lets you make deliberate channel-product pairing decisions rather than distributing inventory equally and hoping for the best.
Step 5 — Account for Working Capital and Cash Flow Differences
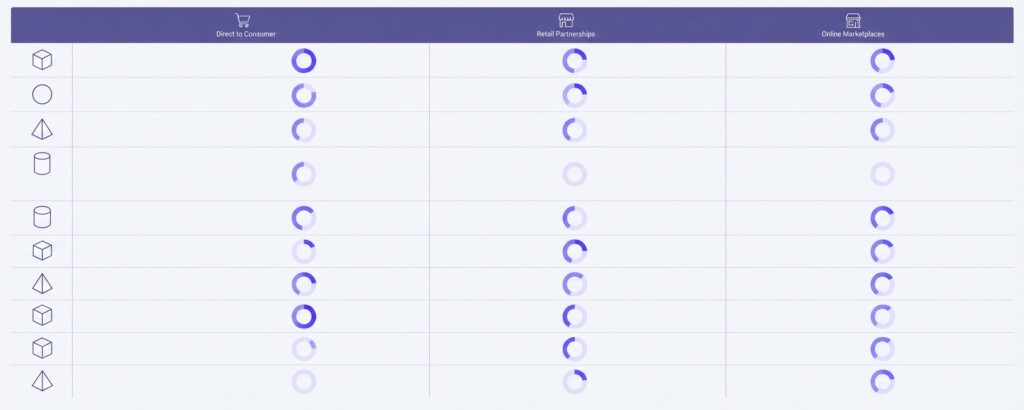
Two channels can produce identical contribution margins but have very different impacts on business cash flow. Amazon holds funds and pays out on a two-week cycle. Shopify payments clear daily or weekly. Wholesale buyers may sit on 30-, 60-, or even 90-day payment terms. For a growing business, this timing difference affects how much working capital you need and what that capital costs.
A wholesale channel generating $6,500 in monthly contribution margin but paid on 60-day terms effectively means you are financing $12,000 of inventory before you collect a dollar. If your cost of capital is 10% annually, that financing cost reduces the real contribution of that channel. Operational channel profitability analysis should include a cost-of-capital adjustment for channels with extended terms.
Building a Monthly Channel Profitability Dashboard
Calculating channel profitability once is useful. Tracking it monthly is transformative. The goal is a dashboard that updates each month with the same structure for every channel, allowing you to spot trends — rising Amazon ad costs, improving Shopify conversion rates, a wholesale account growing in volume — and respond before problems compound.
- Pull channel revenue from each platform (Amazon Seller Central, Shopify reports, wholesale invoices).
- Match COGS to units sold per channel using your standard product cost.
- Import platform fees and fulfilment costs from channel-specific reports or invoices.
- Allocate advertising spend to the channel it was spent on — do not blend ad budgets.
- Estimate returns and chargebacks from platform reports.
- Calculate contribution margin for each channel using the template from Step 2.
- Compare month-on-month and flag any channel where contribution margin has moved more than 3 percentage points.
- Review ROAS against break-even thresholds for each channel’s advertising.
- Identify the top three products by revenue in each channel and check their individual contribution margins.
- Make one strategic decision per month based on the data — not all channels need equal attention.
Common Mistakes in Multi-Channel Profitability Analysis
The most frequent error is using a single blended COGS figure without adjusting for channel-specific product variants or bundle structures. If your wholesale channel buys a standard configuration and your Shopify store sells a premium bundle at a higher COGS, the margin profiles are not comparable without adjustment.
Another common mistake is treating shared fulfilment infrastructure as a fixed cost and excluding it from channel analysis. If your 3PL charges per pick-and-pack order and those charges are directly caused by channel volume, they belong in the channel cost calculation. Only costs that would remain even if the channel closed should be treated as fixed overhead.
Finally, many businesses forget to include the time cost of channel management. Amazon requires active listing management, case filing, and advertising optimisation. Wholesale requires account management, forecasting, and compliance. These are not free — even if they are absorbed internally. A contribution margin calculation that ignores internal labour is overstating real profitability.
How Analytics Tools Can Simplify the Process
Pulling data from Amazon, Shopify, and wholesale into a unified view is the most time-consuming part of this process when done manually. Specialised e-commerce profitability tools (such as Lifetimely, Triple Whale, or Sellerboard) are designed specifically to aggregate multi-channel sales and cost data so that businesses can run contribution margin analysis across channels without manually reconciling spreadsheets. When your channel P&L updates automatically each month, the discipline of reviewing it becomes much easier to maintain.
Whether you use a dedicated analytics platform or a well-structured spreadsheet, the logic of the analysis is the same. The tool matters less than the discipline of running it consistently and acting on what you find.
Making Decisions with Channel Profitability Data
Once you have clean channel profitability data, the decisions become clearer. If Amazon contribution margin is 31% and trending downward due to rising advertising costs, that is a signal to reduce ad bids, rationalise the SKU count on that channel, or negotiate better rates with a freight partner to offset the cost pressure. It is not necessarily a reason to abandon the channel — scale and brand visibility on Amazon can have value beyond the immediate margin — but the decision should be made with accurate numbers, not assumptions.
If Shopify is running at 43% contribution margin and your advertising ROAS is well above break-even, that is where incremental marketing budget should flow first. If wholesale is generating strong margins but with long payment terms and thin volume, consider whether expanding that account or seeking better terms changes the economics materially.
True channel profitability analysis does not always tell you to cut channels. Sometimes it validates that a channel you were deprioritising deserves more investment. The discipline is in following the numbers rather than intuition or revenue volume alone.
The channel generating the most revenue is rarely the channel generating the most profit. Run a proper contribution margin analysis before making any decisions about where to invest marketing budget, allocate inventory, or focus operational resources.
Next Steps
Start with last month’s data. Pull revenue, platform fees, shipping costs, and advertising spend for each channel separately. Apply your COGS. Build the contribution margin table from Step 2. You do not need a sophisticated tool to do this — a clear spreadsheet with the right structure will surface more insight than a complex dashboard with blended numbers. Once you have run the analysis once, set a calendar reminder to repeat it monthly. Channel economics shift — fees change, ad costs fluctuate, product mix evolves. The business that monitors contribution margin by channel every month will consistently outperform one that checks blended margins quarterly.
Track True Channel Profitability in One Place
Dedicated multi-channel analytics tools help e-commerce businesses connect their Amazon, Shopify, and wholesale data to calculate real contribution margins by channel — without the manual spreadsheet work. If you want to understand where your business is actually profitable, automated reporting can help.