How to Use TikTok Shop Product Analytics to Find Which Listings Generate the Highest Contribution Margin After All Platform Deductions

TikTok Shop has grown into a serious sales channel for e-commerce businesses across Southeast Asia and beyond. The appeal is clear: high organic reach, creator-driven discovery, and a frictionless in-app checkout. But many sellers who look profitable on the surface are quietly losing money on individual products once every platform deduction is accounted for. Commission rates, affiliate payouts, shipping subsidies, and promotion contributions all erode revenue before a single ringgit or peso reaches your bank account. This article walks through how to extract meaningful contribution margin data from TikTok Shop’s seller analytics, so you can identify which listings are genuinely worth scaling and which are quietly destroying your margins.
Why TikTok Shop Margin Analysis Is Different From Other Channels
If you sell across Shopify, Shopee, Lazada, and TikTok Shop simultaneously, you already know that each channel has its own cost structure. Shopify gives you close to full revenue control but requires you to fund your own traffic. Shopee and Lazada take commissions and push sellers into promotional campaigns. TikTok Shop introduces a layer that the others do not: the affiliate commission model.
On TikTok Shop, a large portion of sales may be driven by content creators who earn commissions ranging from 5% to 20% or more of the sale price. Those commissions are deducted directly from your settlement. Add the platform commission (typically 1%–8% depending on category and market), any voucher subsidies you co-fund, shipping fee adjustments, and payment processing fees, and the amount you actually receive per order can be significantly lower than the listed selling price. Many sellers only realise this when they reconcile their monthly payouts and find the numbers do not match their expectations.
Understanding the TikTok Shop Deduction Stack
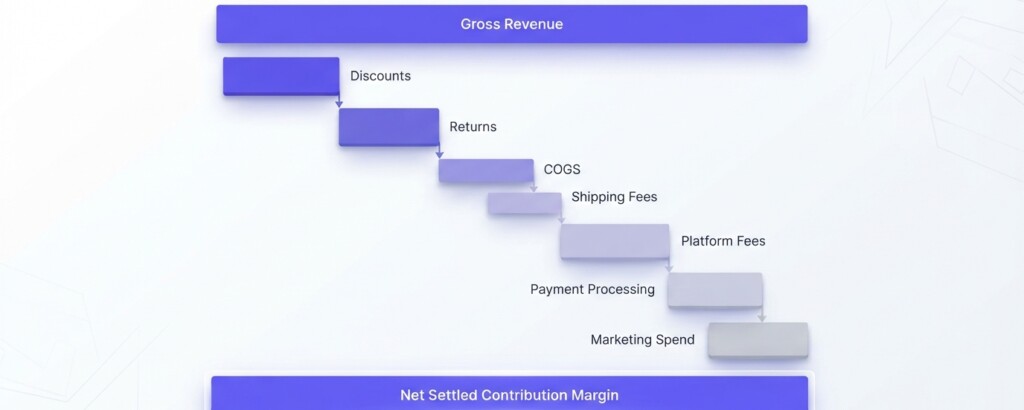
Before you can calculate contribution margin, you need to map every deduction that sits between your listed price and the amount settled to you. The deduction stack on TikTok Shop typically looks like this:
- Selling price (what the customer pays)
- Less: Platform commission (percentage deducted by TikTok Shop based on category)
- Less: Affiliate creator commission (if the sale was driven by a creator collaboration)
- Less: Voucher or discount co-funding (if you participated in a campaign and co-funded the discount)
- Less: Shipping fee subsidy contribution (if TikTok Shop’s free-shipping promotion requires seller contribution)
- Less: Payment processing fee (usually a small percentage per transaction)
- Equals: Net revenue settled to seller
Once you have your net settled revenue, you then subtract your cost of goods sold (COGS) and any variable fulfilment costs — such as packaging and last-mile fees you bear directly — to arrive at contribution margin per unit.
Contribution margin per unit = Net settled revenue − COGS − Variable fulfilment costs. This is the number that tells you whether a product is actually worth selling on TikTok Shop at its current price point.
A Realistic Example: Three Products, Three Very Different Outcomes
Consider a health and beauty seller running three product lines on TikTok Shop. All three sell well by volume and appear profitable when looking at gross sales. The table below shows what happens when you apply the full deduction stack.
| Metric | Vitamin C Serum | Collagen Powder | Face Mask Bundle |
|---|---|---|---|
| Selling price | $32.00 | $48.00 | $22.00 |
| Platform commission (5%) | −$1.60 | −$2.40 | −$1.10 |
| Affiliate commission (15%) | −$4.80 | −$7.20 | −$3.30 |
| Voucher co-funding (seller 50%) | −$1.60 | $0.00 | −$2.20 |
| Shipping subsidy contribution | −$0.80 | −$0.80 | −$0.80 |
| Payment processing (1%) | −$0.32 | −$0.48 | −$0.22 |
| Net settled revenue | $22.88 | $37.12 | $14.38 |
| COGS | −$8.00 | −$18.00 | −$7.50 |
| Packaging & fulfilment | −$1.50 | −$1.50 | −$1.50 |
| Contribution margin per unit | $13.38 | $17.62 | $5.38 |
| Contribution margin % | 41.8% | 36.7% | 24.5% |
On the surface, the face mask bundle looks attractive — it moves volume and the selling price feels reasonable. But after deductions and COGS, it generates only $5.38 in contribution margin per unit, with a margin percentage of 24.5%. If the seller is spending on additional promotions or boosting that listing, the margin shrinks further. The collagen powder, despite higher COGS, has the strongest absolute contribution margin. The serum strikes the best percentage balance.
High gross sales volume on TikTok Shop does not equal profitability. Products driven heavily by creator affiliates at high commission rates can appear as bestsellers in your analytics while generating the lowest contribution margins in your catalogue. Always segment your analytics by sales source — affiliate vs. organic vs. paid — before drawing conclusions.
How to Pull the Right Data From TikTok Shop Seller Center
TikTok Shop’s Seller Center provides several report types that are relevant to this analysis. Here is how to approach each one:
- Go to Finance › Statements. This report breaks down your total settled statements and shows major deduction categories at an account or statement level. Download it for the period you want to analyse.
- Under Finance › Statements, switch to the ‘View by orders’ tab or export the detailed settlement report. This gives you order-level and SKU-level settlement data, showing the net amount paid after all deductions. Export this to a spreadsheet.
- Go to Affiliate › Product Analytics (or Creator Analytics in Affiliate Center). This shows which creator collaborations drove sales and what commission rates applied. Match this back to your order-level data to identify which product SKUs carry the highest affiliate commission load.
- Cross-reference with your internal COGS data. TikTok Shop does not know your cost of goods. You need to maintain a product cost sheet and join it to the settlement export using SKU or product ID.
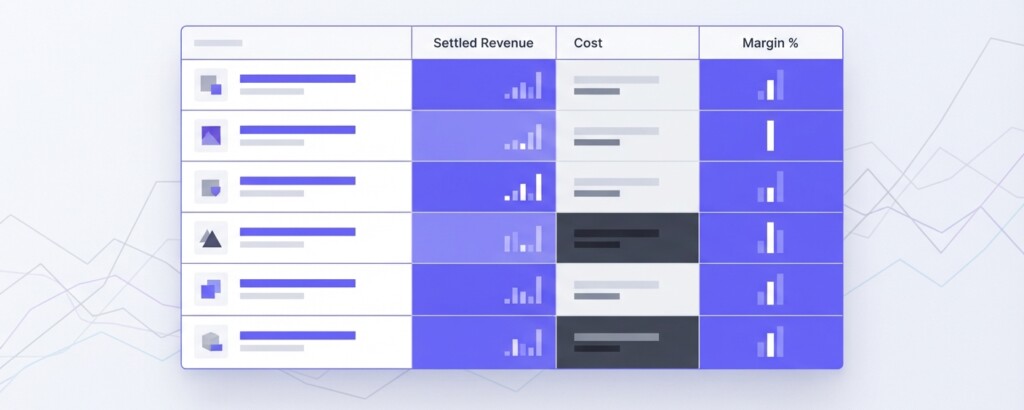
- Build a summary table by SKU showing: total settled revenue, total units sold, average settled revenue per unit, COGS per unit, and contribution margin per unit.
Calculating Contribution Margin at Scale
If you have dozens or hundreds of active SKUs, doing this manually in a spreadsheet becomes time-consuming. The key is to build a repeatable process. The calculation framework below shows how to structure it for a single SKU, which you then replicate across your catalogue.
| Total settled revenue from TikTok Shop (for the SKU, monthly) | $4,576.00 |
| Less: COGS (units sold × cost per unit) | −$1,600.00 |
| Less: Variable packaging and fulfilment costs | −$300.00 |
| Contribution margin (absolute) | $2,676.00 |
| Units sold | 200 units |
| Contribution margin per unit | $13.38 |
| Contribution margin % | 41.8% |
Notice that the deductions from TikTok Shop are already embedded in the settled revenue figure. You are not deducting commissions and fees separately in this step — the settlement report has already done that. What you are adding is your own internal cost data: COGS and any variable costs you bear outside the platform.
Segmenting by Traffic Source: Affiliate vs. Organic vs. SHOP Ads
One of the most valuable analyses you can run is to split your contribution margin by how the sale was generated. A product that sells organically through TikTok’s feed or through your own shop page will have no affiliate commission deduction. The same product sold through a creator collaboration may have a 15%–20% commission on top of the standard platform fee. This distinction dramatically changes your margin.
If your bestselling SKU only generates acceptable margins on organic and paid ad traffic — and loses money on affiliate-driven sales once you account for high creator commissions — you need to either renegotiate commission rates with creators, adjust pricing on affiliate-linked listings, or redirect your affiliate programme toward lower-COGS products.
Similarly, if you are running TikTok Shop Ads (SHOP Ads or Product Shopping Ads), your ad spend should be treated as a variable cost in your contribution margin calculation. Add your ad spend per unit sold — derived from your campaign cost divided by the number of orders attributed to ads — to get a fully loaded contribution margin for ad-driven sales.
Comparing TikTok Shop Margins Against Your Other Channels
Once you have clean contribution margin data for TikTok Shop, the natural next question is how it compares to Shopee, Lazada, and your own Shopify store. Sellers often assume TikTok Shop is the most profitable channel because of its organic reach, but that is not always true when affiliate commissions are high.
| Channel | Avg Selling Price | Avg Net Settled Revenue | COGS | Variable Costs | Contribution Margin | CM% |
|---|---|---|---|---|---|---|
| Shopify (direct) | $32.00 | $30.40 | −$8.00 | −$2.50 | $19.90 | 62.2% |
| TikTok Shop (organic) | $32.00 | $27.84 | −$8.00 | −$1.50 | $18.34 | 57.3% |
| TikTok Shop (affiliate) | $32.00 | $22.88 | −$8.00 | −$1.50 | $13.38 | 41.8% |
| Shopee (standard listing) | $32.00 | $27.52 | −$8.00 | −$1.50 | $18.02 | 56.3% |
| Lazada (standard listing) | $32.00 | $26.88 | −$8.00 | −$1.50 | $17.38 | 54.3% |
This kind of channel comparison instantly clarifies where your marketing and inventory investment should go. Shopify direct is the most profitable channel, as expected, because you are not paying platform commissions. TikTok Shop organic sits close to Shopee and Lazada. But TikTok Shop through affiliates at a 15% creator rate drops your contribution margin by roughly 20 percentage points compared to Shopify direct.
What to Do With Underperforming Listings
Once you have ranked your TikTok Shop SKUs by contribution margin, you have a clear action list. Products in the bottom tier — those with contribution margin percentages below your minimum threshold — need one of the following interventions:
- Reprice upward: If the market allows, increase the selling price to restore margin. Test carefully with organic listings first.
- Cap affiliate commission rates: Reduce the commission you offer creators on that specific SKU. Lower-margin products should not be carrying 15%–20% affiliate rates.
- Remove from promotions: Stop co-funding vouchers on products that cannot absorb the discount.
- Bundle strategically: Pair low-margin SKUs with high-margin products to improve average contribution per order.
- Delist or redirect: If a product consistently fails to meet your minimum contribution margin threshold regardless of pricing or promotion changes, remove it from TikTok Shop and focus it on a channel where the cost structure is more favourable.
Using Analytics Tools to Automate This Process
For sellers managing more than a handful of SKUs across multiple channels, manual spreadsheet reconciliation quickly becomes a bottleneck. The settlement exports from TikTok Shop, Shopee, and Lazada each use different formats and category structures. Joining them together with your internal COGS data requires either significant manual effort or a tool that can connect to these platforms and standardise the data.
BrizoMarket is built specifically for this kind of multi-channel profitability analysis. It connects to your sales channels, pulls settlement and order data, and allows you to overlay your product costs so you can see contribution margin by SKU and by channel in one place — without manually reconciling spreadsheets every month. For finance managers who need to report on product-level profitability across TikTok Shop, Shopee, and Lazada simultaneously, this significantly reduces the time required to produce accurate margin analysis.
Key Takeaways for E-Commerce Operators
TikTok Shop product analytics can tell you which listings are driving sales. But to understand which listings are driving profit, you need to go further — mapping every deduction, overlaying your cost data, and calculating contribution margin at the SKU level. The businesses that grow profitably on TikTok Shop are not necessarily those with the highest GMV. They are the ones who know which products generate sustainable margins after every platform cost has been accounted for, and who make pricing, promotion, and affiliate decisions based on that number.
See Your True Contribution Margin Across Every Channel
BrizoMarket helps e-commerce businesses connect their sales channels and understand product-level profitability after all platform deductions — without manual spreadsheet reconciliation.