How to Use Lazada Seller Centre Advertising Reports to Calculate the True ROAS for Each Ad Type and Reallocate Budget to Your Most Profitable Campaigns
If you are running sponsored ads on Lazada, you are almost certainly looking at the wrong number. The ROAS figure displayed inside Lazada Seller Centre is calculated on attributed revenue — the gross sales value that the platform credits to your ad. It does not account for Lazada’s commission fees, your cost of goods, fulfilment costs, or the platform’s own promotional subsidies. For operators managing margin-sensitive businesses across multiple channels, that surface-level ROAS number can be dangerously misleading.
This article walks through exactly how to pull the right data from Lazada Seller Centre’s advertising reports, adjust for real costs, and calculate a true ROAS — one that reflects what each ad type is actually contributing to your profitability. From there, you can make defensible budget reallocation decisions rather than optimising toward a metric that flatters the platform’s performance.
Understanding What Lazada’s Advertising Reports Actually Show You
Lazada offers three primary ad types inside Seller Centre under Sponsored Solutions: Sponsored Discovery (search and recommendation product ads), Sponsored Affiliate (commission-based external publisher traffic), and Sponsored Display (banner and display placements across the platform). Each has a different cost structure and attribution model, which is the first problem you need to understand before you can make any meaningful comparison.
Inside the Sponsored Solutions section of Seller Centre, navigate to ‘Data Reports’ or ‘Campaign Reports’ and download the full data export. You will find columns for Impressions, Clicks, Ad Spend, Attributed Orders, and Attributed Revenue. The ROAS shown in the dashboard is simply Attributed Revenue divided by Ad Spend. That calculation looks clean, but it does not hold up under financial scrutiny.
Lazada’s attributed revenue typically uses a last-click attribution model — up to 30 days for on-platform solutions like Sponsored Discovery, and 7 days for Sponsored Affiliate. This means a sale is credited to an ad even if the customer returned to the listing organically, used a voucher, or was influenced by a separate Shopee or TikTok Shop interaction earlier in their journey. Always treat attributed revenue as an upper-bound estimate of ad impact, not a confirmed causal figure.
The Four Costs That Distort Your Lazada ROAS
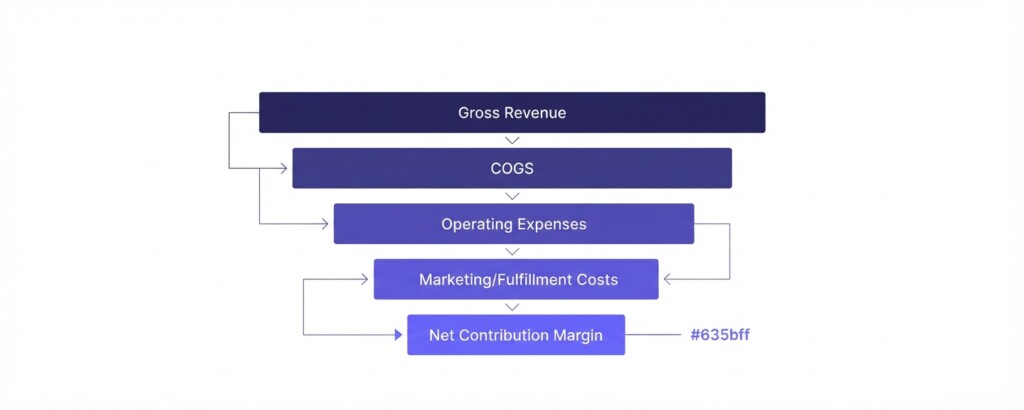
To calculate a true ROAS — one that reflects genuine profit contribution — you need to subtract four categories of cost from your attributed revenue before comparing it against your ad spend.
- Lazada commission fees: These vary by category and country, typically ranging from 4% to 10% or more of the transaction value. Download your Account Statements monthly to find the exact rate applied to each product category you sell.
- Payment processing and service fees: Lazada deducts a service fee and payment fee from every transaction. These are listed in your settlement statement as separate line items and must be factored in.
- Cost of goods sold (COGS): This is your landed product cost — including supplier invoice, inbound freight and import duties — expressed as a percentage of your selling price.
- Fulfilment and shipping costs: Whether you are using Fulfilled by Lazada (FBL) or self-fulfilment, there is a per-order logistics cost that reduces the net revenue available to cover your ad spend.
Building the True ROAS Calculation: A Worked Example
Consider a seller running three ad types on Lazada simultaneously across a skincare product range with an average selling price of 350 Thai Baht. Here is what the Seller Centre dashboard might show for a single month:
| Ad Type | Ad Spend (THB) | Attributed Revenue (THB) | Platform ROAS |
|---|---|---|---|
| Sponsored Discovery | 12,000 | 96,000 | 8.0x |
| Sponsored Affiliate | 8,500 | 51,000 | 6.0x |
| Sponsored Display | 15,000 | 60,000 | 4.0x |
On the surface, Sponsored Discovery looks like the clear winner at 8x ROAS, and Sponsored Display looks like the weakest performer. But when you apply the actual cost structure, the picture changes significantly.
For this product, assume: Lazada commission of 4%, service and payment fees of 2.5%, COGS at 38% of selling price, and fulfilment cost of THB 45 per order (approximately 13% of average selling price at 350 THB). The combined deductions come to approximately 57.5% of gross revenue, leaving a contribution margin of 42.5% before advertising costs.
| Attributed Revenue (Sponsored Discovery) | 96,000 THB |
| Less: Lazada Commission (4%) | -3,840 THB |
| Less: Service & Payment Fees (2.5%) | -2,400 THB |
| Less: COGS (38%) | -36,480 THB |
| Less: Fulfilment Costs (13%) | -12,480 THB |
| Net Contribution Before Ad Spend | 40,800 THB |
| Less: Ad Spend | -12,000 THB |
| Net Contribution After Ad Spend | 28,800 THB |
Your true ROAS for Sponsored Discovery is not 8.0x. It is Net Contribution Before Ad Spend divided by Ad Spend — in this case 40,800 ÷ 12,000 = 3.4x. That is the multiplier that tells you how much contribution margin each baht of ad spend is generating, after real costs are accounted for.
| Ad Type | Platform ROAS | Net Contribution (THB) | True ROAS | Net Profit After Ads (THB) |
|---|---|---|---|---|
| Sponsored Discovery | 8.0x | 40,800 | 3.4x | 28,800 |
| Sponsored Affiliate | 6.0x | 21,675 | 2.6x | 13,175 |
| Sponsored Display | 4.0x | 25,500 | 1.7x | 10,500 |
Notice that Sponsored Affiliate, despite a lower platform ROAS than Sponsored Discovery, still generates a healthy contribution after costs. Sponsored Display generates a true ROAS of 1.7x — meaning for every THB 1 spent on display advertising, you are keeping THB 0.70 in net profit after ad spend, before factoring in fixed overheads. That is the kind of insight the platform dashboard will never show you.
A true ROAS below 1.0x means you are losing money on every sale driven by that ad type — your ad spend exceeds the net contribution the revenue generates after platform fees, COGS, and fulfilment. On the platform dashboard, this corresponds to falling below your break-even platform ROAS (1 ÷ contribution margin %, or around 2.35x for this product category). Any campaign running below that threshold is destroying margin. Identify this before scaling, not after.
How to Calculate Your Break-Even ROAS for Each Product
Break-even platform ROAS is the minimum gross ROAS your campaigns must achieve on the Seller Centre dashboard before advertising adds profit rather than loss. The formula is straightforward: divide 1 by your contribution margin percentage (expressed as a decimal). By contrast, your break-even true ROAS is always 1.0x, since true ROAS is already net of product and platform costs.
If your contribution margin after platform fees, COGS and fulfilment is 42.5% (0.425), your break-even platform ROAS is 1 ÷ 0.425 = 2.35x. Any campaign with a platform ROAS above 2.35x (equivalent to a true ROAS above 1.0x) is contributing positively to profit. Any campaign below 2.35x platform ROAS (or below 1.0x true ROAS) is a net drain. Calculate this separately for each product SKU, because margin percentages vary — a high-volume consumable might have a 30% contribution margin (requiring a 3.33x platform ROAS to break even) while a bundled premium kit might reach 55% (requiring only 1.82x).
Step-by-Step: Pulling and Reconciling the Right Data from Seller Centre
- Download Campaign Reports: Go to Seller Centre → Marketing Center → Sponsored Solutions → Data Reports / Campaign Reports. Select the full month date range, choose all ad types, and export to CSV.
- Download Settlement Statements: Go to Finance → Account Statement. Download the statement or export transaction details matching the same period. This contains your actual net payouts, commission rates and fee breakdowns by order.
- Match Orders to Ad Attribution: Use the order IDs from your Settlement Report to cross-reference with attributed order data where available (such as in Sponsored Affiliate reports or API exports). Where orders match, extract the net settlement value rather than gross GMV.
- Build Your COGS Table: Maintain a simple spreadsheet with each SKU’s landed cost (supplier cost plus inbound freight plus import duties). Express this as a percentage of your Lazada selling price.
- Add Fulfilment Cost per Order: If using Fulfilled by Lazada (FBL), extract the FBL fees from your Account Statement. If self-fulfilling, use your actual courier cost per package.
- Calculate True ROAS by Ad Type: For each campaign or ad type, divide (Attributed Net Revenue minus all variable costs) by Ad Spend.
- Identify Your Break-Even Threshold: Calculate 1 ÷ Contribution Margin % for each key product category to establish the minimum break-even platform ROAS needed in Seller Centre, keeping in mind that break-even true ROAS is 1.0x.
Reallocating Budget Based on True ROAS
Once you have true ROAS figures for each ad type and campaign, budget reallocation follows a disciplined logic. You are not simply moving money from low-ROAS to high-ROAS campaigns — you are evaluating whether the marginal return on additional spend in each channel justifies the allocation, and whether underperforming campaigns can be restructured before being cut.
In the worked example above, Sponsored Display is profitable with a true ROAS of 1.7x (above the 1.0x break-even threshold), but it delivers half the profit multiplier of Sponsored Discovery at 3.4x. If a campaign drops below break-even (a true ROAS under 1.0x or platform ROAS below 2.35x), review the campaign at the ad group level before cutting it entirely. Display ads used for brand awareness at the top of funnel may intentionally run near break-even if they are measurably improving conversion rates in Sponsored Discovery campaigns. If you cannot evidence that relationship through Lazada’s conversion reports, the budget is better redirected.
For Sponsored Discovery campaigns already well above break-even, the question is marginal return. Increasing the daily budget from THB 400 to THB 800 will not necessarily double your attributed revenue if you have already captured most of the high-intent keyword impressions available. Check your impression share and search volume data inside the keyword planner tool within Seller Centre to judge whether incremental spend has room to scale efficiently.
Multi-Channel Context: Comparing Lazada Ad Efficiency Against Shopee and TikTok Shop
Sellers operating across Lazada, Shopee, and TikTok Shop often find that their blended platform ROAS numbers are not comparable because each platform uses a different attribution window and fee structure. Shopee typically charges different commission rates by category and calculates its ROAS over a shorter attribution window. TikTok Shop’s in-feed video ads carry a different cost per click profile and attract buyers at a different stage of purchase intent.
The only fair comparison across channels is true ROAS using a consistent methodology: (Attributed Revenue × (1 − combined platform cost %)) ÷ Ad Spend. When you run this calculation across all three platforms using the same COGS and fulfilment data, you often discover that the channel with the highest platform ROAS is not the most profitable channel when net costs are applied.
This is exactly the kind of multi-channel profitability analysis that BrizoMarket is built to support — connecting your sales data from Lazada, Shopee, Shopify and TikTok Shop into a single view that applies your actual cost structure to each channel, so you can compare true contribution margin and true ROAS without building a bespoke spreadsheet for every reporting cycle.
What to Do With Campaigns That Cannot Reach Break-Even
Not every underperforming campaign should be switched off immediately. Some campaigns serve legitimate strategic purposes — running at marginal loss to defend a keyword from competitors, supporting a product launch that requires initial velocity, or generating reviews that improve organic ranking. The critical discipline is to make these trade-offs consciously, with a defined timeline and exit condition.
If a campaign has been running below break-even ROAS for more than 30 days with no structural changes, with no measurable secondary benefit, and with no improvement trend in its true ROAS week on week, it is consuming margin that could be deployed more effectively. Redirect that budget to your highest true ROAS campaigns, or use it to test new keyword sets and product pairings within Sponsored Discovery before committing to sustained spend.
Key Takeaways and Practical Next Steps
The gap between platform ROAS and true ROAS is not a minor rounding difference — it routinely represents the difference between a profitable advertising programme and one that is quietly eroding your margins at scale. Lazada’s Seller Centre gives you the raw data you need, but it will not apply your cost structure for you. That analytical step is your responsibility as the business operator.
- Download your Campaign Report and Account Statement for the same monthly period from Lazada Seller Centre.
- Build a cost table for each product category: commission rate, service fees, COGS percentage, and fulfilment cost per order.
- Calculate true ROAS for each ad type using net contribution before ad spend divided by ad spend.
- Establish your break-even platform ROAS threshold (1 ÷ contribution margin %) and monitor that true ROAS stays above 1.0x for each key product or category.
- Reallocate budget from campaigns running below break-even toward those demonstrating the highest true ROAS — unless you have a documented strategic reason to sustain the spend.
- Run the same true ROAS methodology across Shopee and TikTok Shop to identify which channel is genuinely generating the most profitable return on your advertising investment.
Compare True ROAS Across All Your Sales Channels in One Place
BrizoMarket connects your Lazada, Shopee, TikTok Shop and Shopify data and applies your actual cost structure — so you can see true contribution margin and true ROAS without rebuilding a spreadsheet every month.