How to Build a Rolling 13-Week Cash Flow Forecast That Accounts for Platform Payout Delays Across Multiple Channels
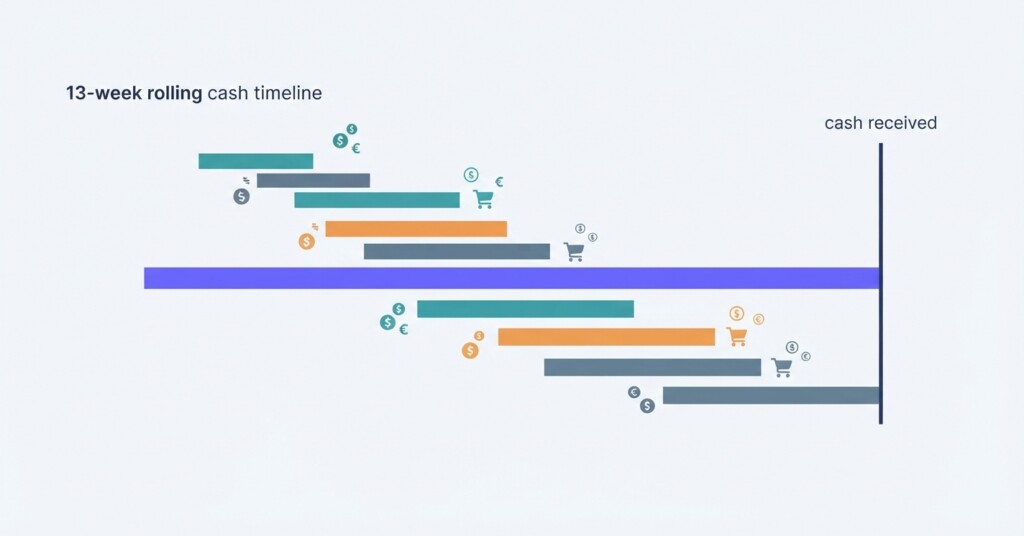
If you sell across Shopify, Shopee, Lazada and TikTok Shop simultaneously, you already know that revenue on paper and cash in your bank account are two very different things. Each platform has its own payout cycle, settlement period and fee deduction schedule. Without a structured cash flow forecast that maps these timing differences, you can find yourself cash-negative during your busiest sales weeks — precisely when you need working capital most.
A rolling 13-week cash flow forecast is the practical solution. It gives you a 90-day forward view of actual cash movements, updated every week, so you can anticipate shortfalls, plan inventory purchases and make confident decisions about marketing spend. This article walks you through building one from scratch, with specific attention to how platform payout delays should be modelled for each channel.
Why Platform Payout Delays Create a Hidden Cash Flow Problem
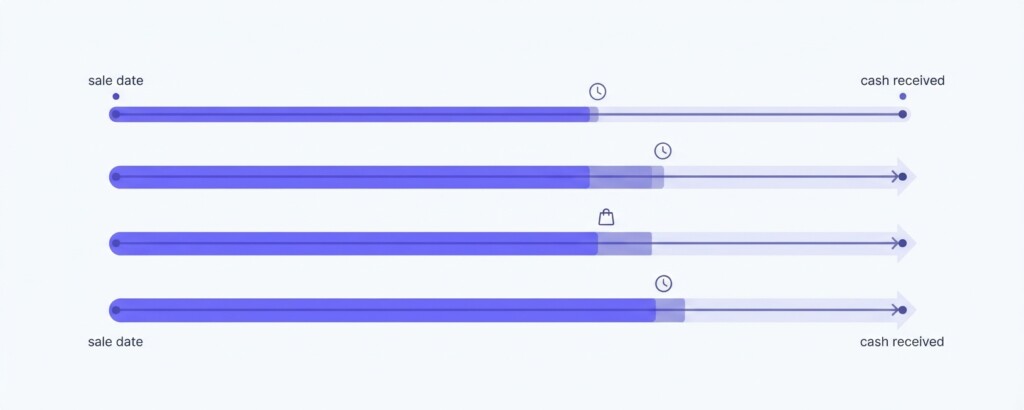
Most e-commerce operators track revenue at the point of sale. A customer checks out on Lazada on Monday — that sale appears in your dashboard on Monday. But the cash from that sale may not reach your bank account for another 7 to 15 days, depending on the platform’s settlement schedule, your seller tier and whether you have any ongoing disputes or holds.
Meanwhile, your costs do not wait. Suppliers expect payment when goods ship. Advertising platforms charge your card daily or weekly. Warehouse fees are invoiced monthly. The gap between when you earn revenue and when you receive cash is your payout float — and across four or five channels, that float can easily represent three to six weeks of operating costs sitting in limbo.
Payout float is the total cash tied up in platform settlement queues at any given moment. For a business doing $150,000 per month across multiple channels, the float can exceed $30,000 — capital that is earned but not yet available.
Understanding Each Channel’s Payout Mechanics
Before building your forecast, document the actual payout behaviour of each channel you operate. The figures below are illustrative examples based on common platform structures — always verify the current schedule in your seller centre, as payout terms can change.
| Channel | Typical Settlement Trigger | Estimated Payout Lag | Fee Deduction Timing | Notes |
|---|---|---|---|---|
| Shopify (own store) | Payment gateway settles daily or on fixed schedule | 1–3 business days | Deducted before payout | Fastest channel; Shopify Payments settles quickly |
| TikTok Shop | Order delivered + review/settlement period | 1–15 days after delivery | Deducted before payout | Timing depends heavily on seller tier and probation status |
| Shopee | Order completed or return period expires | 7–15 days after delivery | Deducted before payout | Credits to Seller Balance first; bank withdrawal takes 1–3 business days |
| Lazada | Delivery confirmed + weekly settlement cycle | 7–15 days after delivery | Deducted before payout | Settlement batched into weekly cycles |
The key insight from this table is that your Shopify revenue converts to cash roughly 10 days faster than your Lazada revenue for the same sale date. If you are shifting marketing spend toward Lazada during a peak period, your cash inflows will lag further than expected — a risk that is invisible unless your forecast models each channel separately.
The Structure of a Rolling 13-Week Cash Flow Forecast
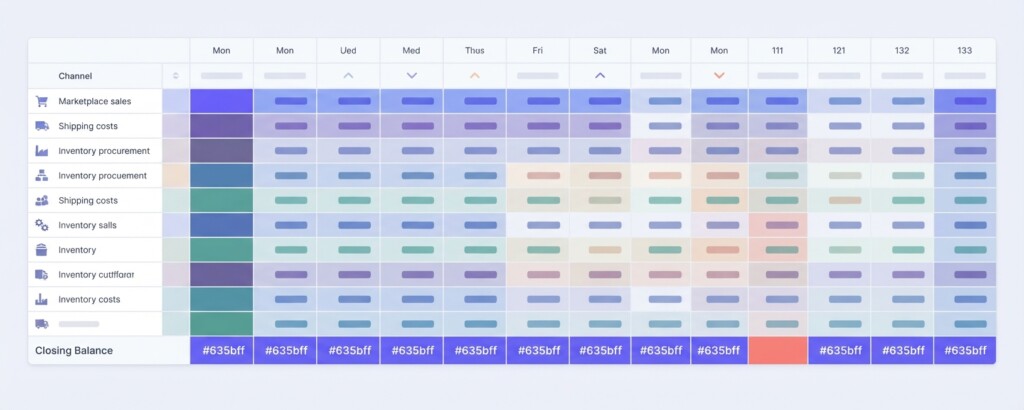
A rolling 13-week forecast is structured as a spreadsheet or financial model with one column per week. Each week, you drop the oldest week off the left and add a new week on the right, so you always have 13 weeks of forward visibility. The model has three layers: cash inflows (by channel, adjusted for payout lag), cash outflows (by cost category) and a closing cash balance.
Here is the recommended structure for the inflows section:
- Start with gross merchandise value (GMV) by channel for each week, based on your sales forecast
- Subtract platform commission fees and payment processing fees to get net revenue per channel
- Apply the payout lag for each channel — shift the net revenue forward by the appropriate number of weeks
- Sum the shifted inflows to produce total expected cash receipts per week
- Add any other inflows: refund recoveries, affiliate credits, financing drawdowns
For example, if you forecast $20,000 GMV on Lazada in Week 1 and your average payout lag is 13 days (roughly two weeks), that cash lands in your forecast in Week 3, not Week 1. The same $20,000 on Shopify lands in Week 2. A simple shift formula in your spreadsheet handles this automatically once you have set the lag parameter for each channel.
Calculating Net Cash Inflow Per Channel
Net cash inflow is not the same as reported revenue. Platforms deduct their fees before transferring funds. You need to model the actual transfer amount, not the gross sale value.
| Gross Merchandise Value (GMV) — Lazada Week 1 | $20,000 |
| Less: Lazada commission fees (approx. 5–8% — use your actual rate) | –$1,400 |
| Less: Payment processing fee (approx. 2%) | –$400 |
| Less: Promotional/voucher subsidies charged to seller | –$300 |
| Net cash receivable from Lazada | $17,900 |
| Applied in forecast: Week 3 (13-day lag) | $17,900 |
Repeat this calculation for every channel. Once you have net receivables by channel by week, apply the lag shift and combine them to produce your total weekly cash inflow row. This is the most important row in your entire model.
Mapping Your Weekly Cash Outflows
On the outflow side, categorise your costs by when payment actually leaves your account — not when the cost is incurred. For most e-commerce businesses, the main outflow categories are:
- Inventory and cost of goods: based on supplier payment terms (e.g., 30-day net, or upfront payment required)
- Paid advertising: Meta, Google, TikTok ads charged weekly or as credit is consumed
- Fulfilment and logistics: 3PL invoices, courier charges, usually weekly or monthly
- Platform subscription and SaaS tools: monthly, charged on a fixed date
- Payroll and contractor payments: fixed schedule, high predictability
- Returns processing and restocking costs: variable, estimated as a percentage of revenue
- Taxes and duties: quarterly or monthly, depending on jurisdiction
Do not confuse accrued costs with cash outflows. When you receive inventory, the cost is accrued on your P&L — but cash does not leave until the supplier invoice is paid. Your cash flow forecast must reflect actual payment dates, not accrual dates. Mixing these up is the most common modelling error in e-commerce cash forecasts.
Building the Rolling Cash Balance
Once you have inflows and outflows mapped by week, the closing cash balance is straightforward: opening cash plus net cash inflow minus total outflows equals closing cash. That closing balance becomes next week’s opening balance.
| Week | Opening Cash | Channel Inflows | Total Outflows | Net Movement | Closing Cash |
|---|---|---|---|---|---|
| Week 1 | $45,000 | $28,400 | $34,200 | –$5,800 | $39,200 |
| Week 2 | $39,200 | $31,000 | $29,500 | +$1,500 | $40,700 |
| Week 3 | $40,700 | $17,900 (Lazada W1 arrives) | $31,000 | –$13,100 | $27,600 |
| Week 4 | $27,600 | $38,500 | $27,000 | +$11,500 | $39,100 |
Notice Week 3 in the example above. Outflows are high — perhaps a large inventory purchase — and the inflow is lower because it primarily reflects a smaller Lazada payout from two weeks prior. Without the forecast, this cash dip would be a surprise. With it, you can either delay the inventory order by one week or arrange a short-term credit facility in advance.
How to Handle Seasonal Peaks and Promotion Events
11.11, 12.12, Ramadan sales and mid-year campaigns all generate a spike in GMV — followed by a spike in payout inflows two weeks later. This lag means your cash position can actually deteriorate during the peak itself, as you spend on advertising, staffing and logistics before the settlement arrives.
To model this correctly, create a promotion scenario layer in your forecast. Increase GMV in the promotion week by your expected uplift factor, then shift those inflated inflows forward by the platform lag. Run the outflows for the promotion week at full cost. This will show you clearly whether you need pre-arranged working capital before the event starts.
Rule of thumb for promotions: assume you will need working capital equal to roughly two weeks of your expected peak outflows before any promotional cash settlements arrive. Build this buffer into your plan at least four weeks in advance.
Tracking Forecast Accuracy and Updating Weekly
A forecast that is not updated is just a document. The rolling structure works because you revisit it every week and compare your actual cash movements against what you predicted. Track two accuracy metrics: inflow variance (actual channel payout vs. forecast) and outflow variance (actual spend vs. forecast). Over time, you will learn whether your lag assumptions are correct and which channels generate the most forecast error.
Tools like BrizoMarket can help here by pulling actual sales and fee data from Shopify, Shopee, Lazada and TikTok Shop into a single view, making it easier to populate your weekly actuals without manually exporting from four different seller dashboards. When your actuals are clean and fast to retrieve, the weekly update takes 30 minutes rather than half a day.
Contribution Margin as Context for Your Channel Planning
While your weekly cash inflow rows track net platform payouts rather than profitability, your underlying sales planning must account for contribution margin by channel — revenue minus COGS minus channel fees minus fulfilment costs. This reflects the true cash-generating power of each channel once related outflows clear, preventing you from over-indexing on high-GMV channels that drain working capital.
A channel with $50,000 GMV and a 15% contribution margin generates $7,500 of cash contribution. A channel with $30,000 GMV and a 35% contribution margin generates $10,500. When deciding which channel to prioritise for inventory and advertising investment, combining margin analysis with the cash flow model will show you which decision creates the stronger cash position — not just the higher revenue number.
Practical Next Steps to Get Started This Week
- Pull your last 8 weeks of payout statements from each channel and calculate your actual average payout lag per platform
- Set up a spreadsheet with 13 weekly columns, one inflow row per channel and standard outflow category rows
- Populate Weeks 1–4 with confirmed sales data and known outflows; use your sales trend for Weeks 5–13
- Apply your actual payout lag to shift each channel’s inflow forward by the correct number of weeks
- Identify any weeks where closing cash falls below your minimum operating buffer and plan your response now
- Schedule a 30-minute weekly update session every Monday to roll the forecast forward and record actuals
The 13-week rolling cash flow forecast is not a complex financial instrument. It is a disciplined habit of tracking where your cash actually is — not where your revenue dashboard says it should be. For multi-channel e-commerce operators, this discipline is what separates businesses that grow confidently from those that run out of runway during their best trading periods.
Get Multi-Channel Financial Clarity in One Place
BrizoMarket helps e-commerce operators consolidate sales, fee and margin data across Shopify, Shopee, Lazada and TikTok Shop — so you can build accurate cash flow forecasts without the manual data extraction.