How to Use TikTok Shop Traffic Source Reports to Understand Whether Your Sales Are Driven by Organic Content or Paid Ads
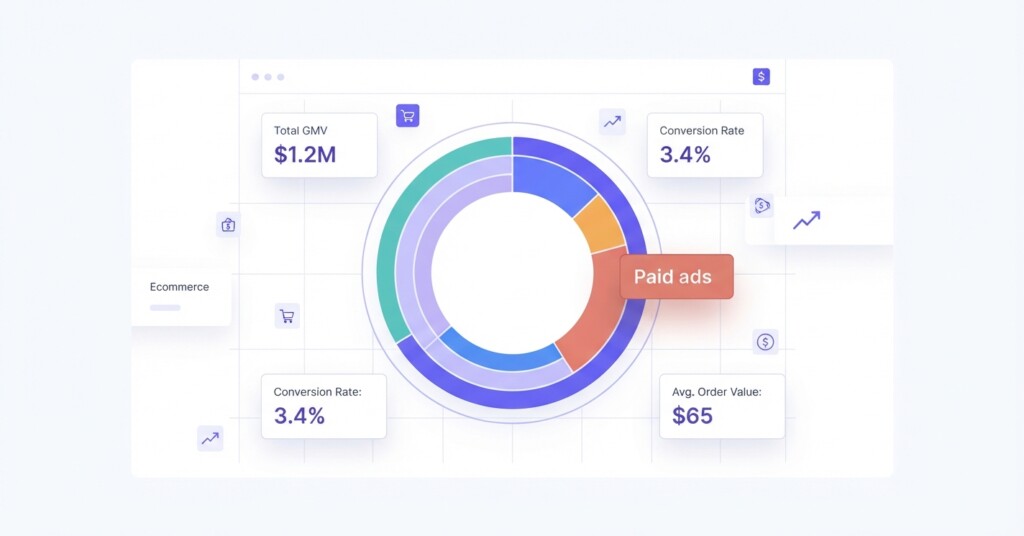
If you are running a TikTok Shop alongside other channels like Shopify, Shopee or Lazada, one of the most important questions you need to answer is deceptively simple: where are your TikTok Shop sales actually coming from? Are they the result of organic short-form content and creator videos, or are they being propped up by paid advertising spend? The answer has a direct impact on your true profitability, your marketing budget decisions, and whether your TikTok Shop channel is genuinely sustainable.
TikTok Shop provides Traffic Source Reports inside Seller Center that break down your orders and revenue by the source of traffic that drove each conversion. Most sellers glance at their total GMV and move on. The ones who build profitable, scalable businesses go one level deeper and understand the composition of that revenue — and what it actually cost to generate it.
What the TikTok Shop Traffic Source Report Actually Shows
Inside TikTok Shop Seller Center, navigate to Analytics, then to Traffic Analysis or the equivalent reporting section available in your market. The Traffic Source breakdown typically segments your orders and revenue across several categories:
- Short Video: Sales attributed to organic or promoted short-form video content
- LIVE: Sales driven during live streaming sessions
- Shop Tab / Search: Customers who found your products by browsing or searching within TikTok Shop directly
- Product Sharing / Affiliates: Orders from affiliate creators sharing your product links
- Paid Ads (TikTok Ads Manager): Sessions and conversions driven by your paid campaign spend
- Others / Direct: Sessions that do not match a specific trackable source
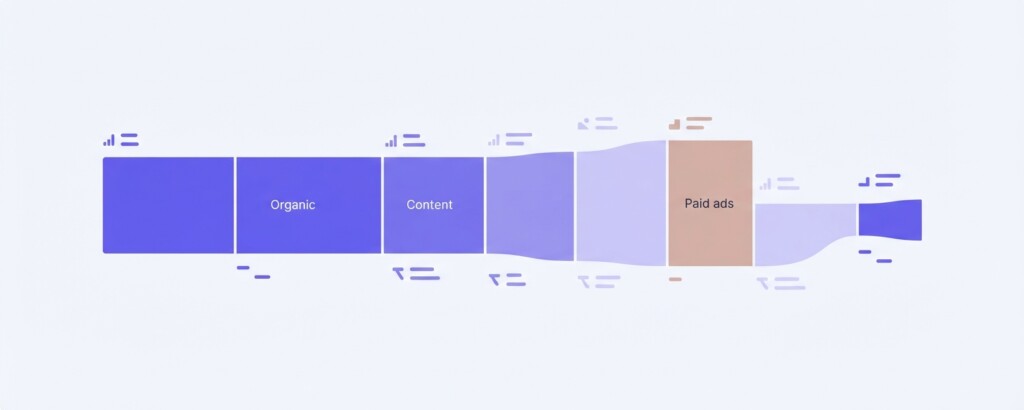
The critical insight this report provides is not just the volume of sales from each source — it is the relative mix. A seller generating 80% of their GMV from paid ads is running a very different business to a seller generating 80% from organic video content and the Shop Tab. Both might show the same top-line revenue number, but their cost structures and risk profiles are completely different.
Why the Organic vs Paid Split Determines Your Real Margin
Consider a realistic example. A seller of skincare products generates $40,000 in GMV on TikTok Shop in a given month. The platform commission, payment fees and fulfilment costs bring gross margin to approximately 45%. On the surface this looks healthy.
But when you pull the Traffic Source Report, you find that $28,000 of that GMV — 70% — came from paid TikTok Ads campaigns. The remaining $12,000 came from organic short videos and the Shop Tab. If the seller spent $9,500 on ads to generate that $28,000 in paid-attributed GMV, their Return on Ad Spend (ROAS) is 2.95x. That sounds acceptable in isolation, but when you factor in the platform fees, product cost and fulfilment on that paid revenue, the contribution margin on the paid portion shrinks dramatically.
| Paid-Attributed GMV | $28,000 |
| Less: Platform Commission & Fees (approx. 8%) | −$2,240 |
| Less: Cost of Goods Sold (approx. 40% of GMV) | −$11,200 |
| Less: Fulfilment & Shipping Costs | −$2,800 |
| Gross Profit on Paid Revenue | $11,760 |
| Less: Ad Spend to Generate Paid Revenue | −$9,500 |
| Contribution Margin After Ad Spend | $2,260 |
That $2,260 contribution margin on $28,000 of paid revenue represents a contribution margin rate of just 8.1%. Meanwhile, the $12,000 in organic revenue — which required no additional ad spend — retains a contribution margin closer to 37% after fees and COGS. This is why the traffic source split is not just a curiosity; it is a core profitability signal.
The rule of thumb worth internalising: organic-attributed revenue on TikTok Shop almost always carries a meaningfully higher contribution margin than paid-attributed revenue, because it lacks the variable cost of ad spend. Growing your organic share is therefore a direct lever on channel profitability — not just a vanity metric.
How to Read the Traffic Source Data Without Drawing Wrong Conclusions
TikTok’s attribution model, like most platform-native attribution, operates primarily on a last-touch basis (typically defaulting to a 7-day click and 1-day view window within its ecosystem). This means a customer who discovered your brand via an organic video but subsequently viewed or clicked a paid ad before purchasing will likely be attributed to the paid ad. This tends to inflate the apparent value of paid traffic and deflate the credited contribution of organic content.
Practically, this means you should treat the organic traffic source number as a conservative floor, not a ceiling. If your organic share appears to be growing month over month even as you reduce ad spend, that is a meaningful positive signal about your content strategy and product-market fit on the platform.
Do not switch off paid ads suddenly based on traffic source data alone. If a significant portion of your ‘organic’ conversions are influenced by paid impressions earlier in the session path, a hard reduction in ad spend may cause organic-attributed sales to drop as well. Test reductions gradually and monitor all traffic source lines simultaneously, not just the paid line.
Building a Traffic Source Analysis Table for Monthly Review
Rather than checking traffic sources in isolation, create a structured monthly view that connects each source to its cost and margin contribution. The following table illustrates what this structured analysis looks like for a diversified $40,000 monthly store breakdown:
| Traffic Source | GMV | % of Total GMV | Attributed Cost | Est. Contribution Margin % |
|---|---|---|---|---|
| Organic Short Video | $8,500 | 21% | $0 direct ad spend | ~37% |
| LIVE Sessions | $3,500 | 9% | $0 direct ad spend | ~35% |
| Shop Tab / Search | $4,200 | 10% | $0 direct ad spend | ~37% |
| Affiliate / Product Sharing | $3,800 | 10% | Affiliate commission ~10% | ~27% |
| Paid TikTok Ads | $20,000 | 50% | $7,800 ad spend | ~9% |
This view immediately surfaces the strategic tension. Half of revenue is coming from paid ads, but its contribution margin is far below the organic channels. If the business goal is channel profitability rather than GMV maximisation, the obvious priority is investing in content and LIVE capacity to grow the organic and LIVE rows — while ensuring paid campaigns are running with disciplined ROAS targets that account for full costs, not just ad platform ROAS.
Setting Minimum ROAS Thresholds Based on Your Actual Cost Structure
Many TikTok Shop sellers manage paid campaigns to a ROAS target of 3x or 4x without calculating whether that threshold actually produces a positive contribution margin for their specific product and cost structure. The break-even ROAS formula helps you set a defensible minimum.
| Selling Price per Unit | $50.00 |
| Less: COGS | −$20.00 |
| Less: Platform Fees & Commission (8%) | −$4.00 |
| Less: Fulfilment & Shipping | −$5.00 |
| Available for Ad Spend (Max) | $21.00 |
| Break-Even ROAS (50 / 21 × 1) | 2.38x minimum |
In this example, any paid campaign producing a ROAS below 2.38x is generating a negative contribution margin — every sale is losing money at the campaign level. If you want a 15% contribution margin after ads, you need to calculate what ad spend per dollar of revenue that allows, and set your ROAS target accordingly (in this case, approximately 3.7x).
The important discipline is to run this calculation per product or per product category, not at the account level. High-margin products can sustain a lower ROAS. Low-margin products need a higher ROAS to remain profitable. Blending across the account hides both your winners and your loss-makers.
Comparing TikTok Shop Traffic Mix Against Other Channels
If you are operating across multiple channels — Shopify, Shopee and Lazada alongside TikTok Shop — understanding TikTok’s organic-to-paid ratio becomes especially useful as a channel comparison. Marketplaces like Shopee and Lazada have their own paid promotion tools (search ads, banner placements, flash sale fees) that similarly inflate platform revenue while compressing margin.
A business running TikTok Shop with a strong organic content programme may find that its TikTok contribution margin is actually superior to its Shopee margin, once Shopee’s promotion fees, coins cashback costs and platform commissions are properly accounted for. Traffic source analysis enables you to make this comparison honestly, rather than comparing top-line GMV figures that tell you nothing about channel health.
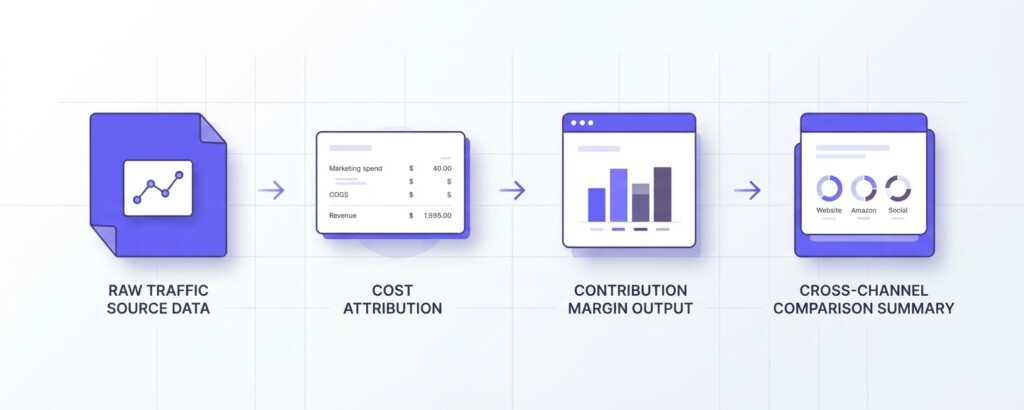
Tools that consolidate multi-channel data — pulling TikTok Shop performance alongside Shopify revenue, Shopee orders and Lazada sales into a unified profitability view — significantly reduce the time and error involved in this kind of cross-channel analysis. BrizoMarket is built specifically for this use case, helping ecommerce operators see contribution margin and channel performance side-by-side rather than logging into four separate dashboards and reconciling data manually in spreadsheets.
Practical Steps to Action Your Traffic Source Analysis
- Pull your TikTok Shop Traffic Source Report weekly and record the GMV by source in a consistent tracking sheet. Look at trends over 4 to 8 weeks rather than single-period snapshots.
- Calculate contribution margin separately for your organic revenue and your paid revenue using actual COGS, fees and ad spend figures — not platform-reported ROAS alone.
- Set a break-even ROAS floor for each product category based on your margin structure, and flag any campaign running below that threshold for review or pause.
- Track your organic GMV share as a percentage of total TikTok GMV each month. A rising organic share with stable or growing absolute GMV is a strong indicator of sustainable channel growth.
- If affiliate or product-sharing traffic is a meaningful source, calculate net margin after commission separately — affiliate revenue carries a real cost that needs to be isolated from true organic performance.
- Compare your TikTok Shop contribution margin (blended across all traffic sources) against your other channels on a like-for-like basis, ensuring each channel bears its own platform fees, fulfilment costs and marketing costs.
The Bottom Line
TikTok Shop Traffic Source Reports give you the raw materials to answer a question that directly affects your channel strategy and budget allocation: how much of your revenue is self-sustaining through content and discovery, and how much depends on continuous ad spend to exist? A channel with strong organic share is more resilient, more profitable per dollar of revenue, and less vulnerable to rising CPM costs or platform policy changes.
The sellers who build durable TikTok Shop businesses are not necessarily those with the biggest ad budgets. They are the ones who track their traffic mix systematically, calculate real contribution margins by source, and use that information to gradually shift the balance toward organic and content-driven revenue — while running paid campaigns at defensible ROAS thresholds that actually protect margin.
Start with one month of traffic source data, build the contribution margin table outlined above, and you will immediately have a clearer picture of what your TikTok Shop channel is actually worth to your business.
Analyse Your TikTok Shop Performance Alongside Every Channel
BrizoMarket helps ecommerce operators consolidate multi-channel sales data and calculate true contribution margins across TikTok Shop, Shopify, Shopee, Lazada and more — so you can make channel and budget decisions based on real profitability, not just GMV.