How to Use Cohort Analysis in Shopify Analytics to Measure Repeat Purchase Rate by Acquisition Channel
If you are running a Shopify store alongside channels like Shopee, Lazada or TikTok Shop, you already know that acquiring a customer is only half the battle. The real question is whether that customer comes back — and whether the channel that brought them in is actually delivering long-term value or just one-off transactions that erode your margins once you account for acquisition costs.
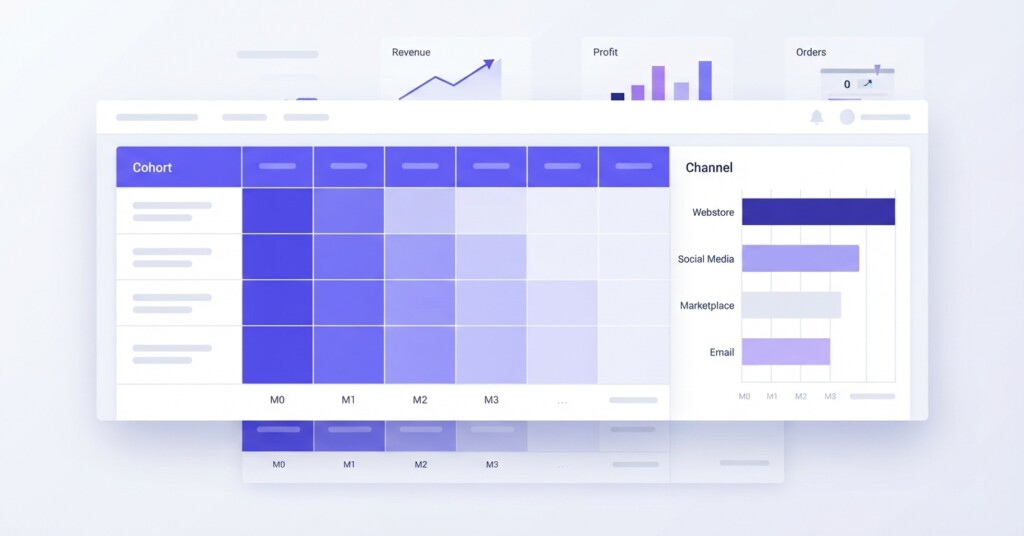
Cohort analysis is one of the most powerful tools available inside Shopify Analytics for answering that question with precision. When used correctly, it lets you group customers by when they first purchased and by which channel acquired them, then track how many of those customers return to buy again over subsequent months. This gives you a repeat purchase rate that is grounded in real behaviour rather than blended averages that hide the performance differences between channels.
This article walks you through how to set up and read cohort analysis in Shopify, how to segment it by acquisition channel, what the numbers actually mean for your profitability, and what actions to take based on what you find.
What Cohort Analysis Actually Measures
A cohort is simply a group of customers who share a common characteristic at a specific point in time. In the context of repeat purchase analysis, that characteristic is the month they made their first-ever order from your store. Shopify groups these customers automatically and then shows you how many of them returned to purchase in each subsequent month.
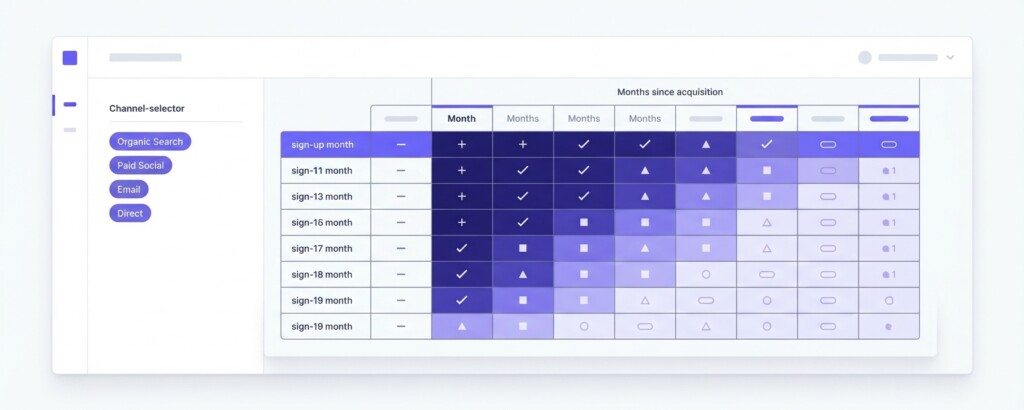
The result is a retention grid — sometimes called a cohort table — where each row represents a group of customers acquired in a given month, and each column represents the months that followed. The values inside the grid tell you what percentage of that original cohort came back to buy again.
Repeat purchase rate by cohort is not the same as your overall returning customer rate shown on the dashboard. The dashboard figure is a blended average across all orders in a date range. Cohort analysis isolates behaviour by when a customer first arrived, giving you a time-accurate picture of loyalty and retention.
For example, if your January cohort shows a 28% return rate in month two and a 14% rate in month four, that tells you roughly one in four customers makes a second purchase within 60 days. Whether that is good or poor depends entirely on your product category, average order value and the cost you paid to acquire that customer in the first place.
How to Access Cohort Analysis in Shopify Analytics
Cohort analysis is available on the Shopify plan and above. Here is how to reach it and configure it usefully.
- Log into your Shopify admin and navigate to Analytics > Reports.
- Under the ‘Customers’ section, select ‘Customer cohort analysis’.
- Set your date range to cover at least 6–12 months of acquisition data so you have meaningful cohort rows to compare.
- In the configuration panel, select ‘Customer retention rate’ (or ‘Number of customers’) under the Metric menu to evaluate retention percentages or cohort volume.
- Use the ‘Intervals’ menu to change between monthly, weekly or quarterly groupings. Monthly is most useful for the majority of stores.
- Under Cohort definition, filter by ‘Marketing channel’ or ‘Sales channel’ — this is the critical step for segmenting by where customers came from.
The acquisition channel filter inside Shopify relies on UTM parameters and Shopify’s own attribution logic. This means your repeat purchase analysis is only as good as your channel tagging. If your paid social campaigns, email flows and organic traffic are not consistently tagged with UTM source parameters, the channel breakdown will be incomplete or misleading.
Before relying on channel-segmented cohort data, audit your UTM tagging across all active channels. TikTok Shop orders that flow through the Shopify integration may attribute differently than direct TikTok ad traffic landing on your Shopify store. Check that your Shopee and Lazada traffic — if tracked via external links — carries consistent source tags. Missing attribution distorts the entire analysis.
Reading the Cohort Table: A Practical Example
Suppose you run a skincare brand selling on Shopify, with traffic coming from paid Meta ads, organic search and TikTok Shop. After filtering your cohort analysis by acquisition channel, your table might look something like this:
| Acquisition Channel | Cohort Month | Month 0 (First Purchase) | Month 1 Retention | Month 2 Retention | Month 3 Retention |
|---|---|---|---|---|---|
| Meta Paid Social | January | 100% | 18% | 12% | 9% |
| Organic Search | January | 100% | 31% | 22% | 17% |
| TikTok Shop | January | 100% | 11% | 7% | 4% |
| Meta Paid Social | February | 100% | 16% | 11% | 8% |
| Organic Search | February | 100% | 29% | 20% | 15% |
| TikTok Shop | February | 100% | 12% | 6% | 3% |
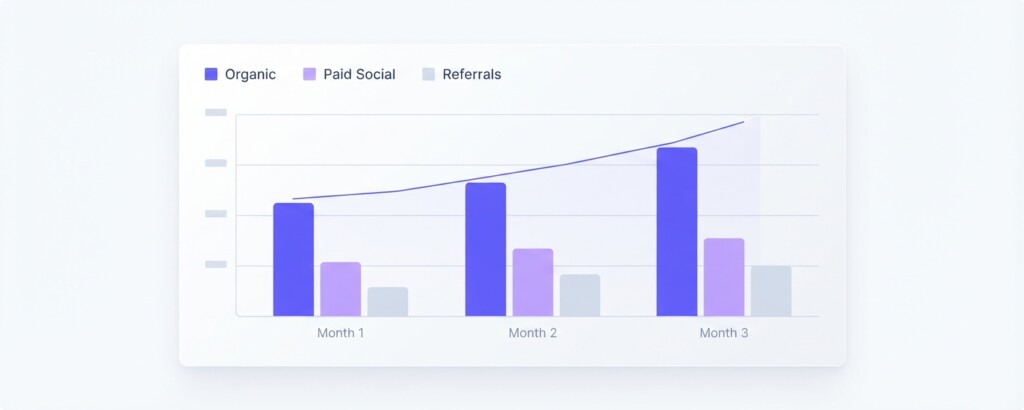
This table tells a clear and commercially important story. Customers acquired through organic search are returning at roughly twice the rate of customers acquired through TikTok Shop. By month three, organic customers are still purchasing at a 17% rate while TikTok Shop customers have dropped to just 3–4%.
This does not automatically mean TikTok Shop is a bad channel. It might be generating strong first-order volume at an acceptable cost. But it does mean you cannot rely on TikTok Shop customers to generate the repeat revenue that justifies high acquisition spending. The channel may need to be evaluated on different terms — perhaps as a top-of-funnel discovery tool rather than a loyalty channel.
Connecting Repeat Purchase Rate to Profitability
Repeat purchase rate becomes commercially meaningful when you connect it to your customer acquisition cost (CAC) and gross margin. A customer who purchases twice generates more lifetime gross profit than a one-time buyer — but only if that second purchase covers enough margin to justify the cost of acquiring them in the first place.
Consider two channels with identical first-order revenue but very different retention behaviour:
| Average order value (both channels) | $85.00 |
| Gross margin per order (45%) | $38.25 |
| CAC — Organic Search channel | $12.00 |
| CAC — TikTok Shop channel | $28.00 |
| Month 0 contribution margin — Organic ($38.25 – $12.00) | $26.25 |
| Month 0 contribution margin — TikTok ($38.25 – $28.00) | $10.25 |
| Month 1–3 repeat gross profit — Organic (avg 23% rate × $38.25 × 3) | $26.41 |
| Month 1–3 repeat gross profit — TikTok (avg 7% rate × $38.25 × 3) | $8.03 |
| Total 3-month contribution — Organic | $52.66 |
| Total 3-month contribution — TikTok | $18.28 |
Combined with a lower CAC and stronger retention, organic search customers generate nearly three times the three-month contribution margin of TikTok Shop customers in this example. This is the kind of analysis that should directly inform where you allocate your marketing budget — not your blended ROAS figures or platform-reported returns.
Segmenting Further: Product Category and Geography
Once you have a clear channel-level picture, you can deepen the analysis by looking at whether repeat purchase behaviour varies by the product a customer first bought. In Shopify, you can filter cohorts directly by first-order product name within the configuration panel, or examine product drill-down details. For more advanced cross-channel product tracking or complex SKU groupings, exporting raw order data into a spreadsheet or BI tool remains a helpful option.
For example, customers who first purchased a starter kit or a subscription product often show significantly higher repeat rates than customers who bought a one-off promotional item. If your TikTok Shop campaigns are mostly promoting steep discount bundles while your organic search is capturing customers looking for specific product solutions, that difference in product type may partly explain the retention gap — not just the channel itself.
This distinction matters operationally. If you restructure your TikTok Shop listings to lead with products that have higher natural repeat demand — replenishable consumables, for instance — you may improve the channel’s cohort performance without changing your ad spend.
Using BrizoMarket to Extend the Analysis Across Channels
Shopify’s native cohort analysis is useful but limited to Shopify order data. If you are selling simultaneously on Shopee, Lazada and TikTok Shop, your cohort picture is fragmented across multiple platforms — and none of them natively let you compare retention rates side by side with a unified view of contribution margin.
BrizoMarket is built specifically for this multi-channel context. It consolidates order and customer data from Shopify, Shopee, Lazada and TikTok Shop into a single analytics layer, allowing you to run profitability and retention analysis across all channels using consistent definitions. Rather than exporting CSVs from four platforms and reconciling them manually, you can see which acquisition channels are generating genuinely profitable repeat customers — across your entire business, not just your Shopify storefront.
What Good Repeat Purchase Rates Look Like
There is no universal benchmark for repeat purchase rate because it varies significantly by product category, price point and purchase frequency. A business selling printer ink should see very different retention curves than one selling luxury homewares. Instead of comparing yourself to industry averages, focus on relative performance across your own channels and cohorts over time.
That said, there are useful internal benchmarks to monitor:
- Is your month-one repeat rate improving or declining across consecutive cohorts? A declining trend may indicate deteriorating product-market fit or changes in the quality of traffic you are acquiring.
- Is the gap between your best and worst channels growing over time? A widening gap often signals that your marketing mix is pulling in different types of customers with structurally different lifetime value profiles.
- Are any product categories showing dramatically higher retention than others? This is a strong signal about where to focus product development and channel investment.
- Does retention improve after you run email or SMS re-engagement flows? Measuring this as a cohort intervention is a direct way to quantify the revenue impact of your retention marketing.
Practical Next Steps
Start with a UTM audit. Every active channel — paid search, paid social, email, influencer, organic — should be consistently tagged before you draw conclusions from channel-segmented cohort data. This is a one-time setup that pays dividends in every subsequent analysis.
Next, run your cohort analysis covering the last six months and filter it by acquisition channel. Identify which channels show the steepest drop-off after month one, then cross-reference those channels with their actual CAC to calculate whether first-order contribution margin is sufficient even without repeat purchases.
Finally, set a quarterly cadence to review cohort performance. Customer behaviour shifts gradually, and a channel that shows weak retention today may improve as you optimise your post-purchase flows, product mix or discount structure. Tracking cohorts over time turns a single snapshot into a genuine management tool.
The most actionable output of cohort analysis is not a number — it is a decision. Which channels deserve more budget because they generate customers who stay? Which channels need restructuring because their customers buy once and disappear? Answer those questions with data, and your marketing spend becomes a direct lever on long-term profitability.
Analyse Repeat Purchase Rates Across All Your Sales Channels
BrizoMarket connects your Shopify, Shopee, Lazada and TikTok Shop data so you can measure customer retention, contribution margin and channel profitability in one place — without manual exports or spreadsheet reconciliation.