How to Use Shopify Acquisition Reports to Calculate the True CAC for Each Paid Channel and Decide Where to Reinvest Your Ad Budget
If you are running paid ads across Google, Meta, TikTok, or any other channel and routing traffic to your Shopify store, you almost certainly know your spend. What most operators do not know with any precision is what that spend actually produced — not in clicks or sessions, but in profitable customers. Customer Acquisition Cost (CAC) is one of the most important financial metrics in e-commerce, yet it is routinely miscalculated, misattributed, or simply ignored in favour of platform-reported ROAS. This article explains how to use Shopify’s acquisition and marketing reports alongside your own cost data to calculate a true, channel-level CAC and use that number to make better reinvestment decisions.
Why Platform-Reported ROAS Is Not Enough
Every ad platform — Meta Ads, Google Ads, TikTok Ads — reports its own version of return on ad spend. The problem is that each platform claims credit using its own attribution model, which almost always overstates its contribution. A customer who clicked a TikTok ad, then a Google Shopping ad, then converted through a Meta retargeting ad will likely be counted as a full conversion by all three platforms simultaneously.
Beyond attribution overlap, platform ROAS ignores the cost of goods, fulfilment, platform fees, returns, and customer service. A channel reporting a 4× ROAS might be generating orders at a gross margin of 20%, leaving you with a contribution loss once you account for all variable costs. True CAC, calculated using your actual spend and the real number of new customers acquired, tells a very different story.
True CAC measures what you actually paid to acquire one new customer — not what a platform claims it cost. It should always be evaluated alongside gross margin and customer lifetime value, not ROAS alone.
Understanding Shopify's Acquisition Reports
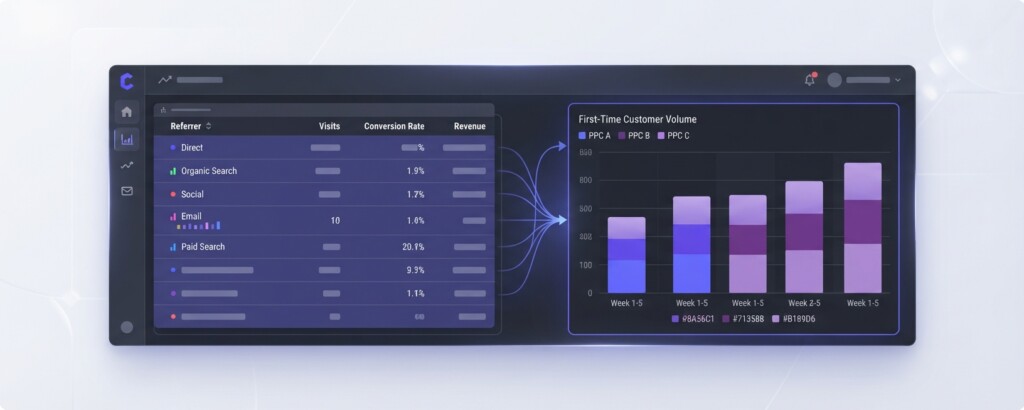
Shopify’s built-in analytics includes an ‘Acquisition’ section under Reports, which focuses specifically on visitor and session metrics (such as ‘Sessions by referrer’). Acquisition reports do not display converted orders or sales. To view orders and revenue broken down by marketing touchpoints, merchants use Shopify’s Marketing and Sales reports (such as ‘Sales attributed to marketing’ and ‘Performance by marketing channel’), where attribution models like first click, last click, and last non-direct click can be applied across subscription tiers.
The key native reports to work with are: ‘Sessions by referrer’ (in Acquisition), ‘Total sales by referrer’ (in Sales), and ‘Performance by marketing channel’ or ‘Sales attributed to marketing’ (in Marketing). These pull from Shopify’s own tracking rather than relying on platform pixels, giving you a more neutral view of which channel introduced the customer who eventually converted.
Shopify also distinguishes between first-time customer orders and returning customer orders. This distinction is critical. When calculating CAC, you should only count orders from first-time customers — returning customers are, by definition, already acquired. If you divide total ad spend by all orders (including repeat purchases), you will systematically underestimate your true acquisition cost.
Step-by-Step: Calculating True CAC per Channel
The following process works for any store running paid traffic from two or more sources. The example below uses a hypothetical store selling skincare products, running campaigns on Meta, Google, and TikTok simultaneously over a 30-day period.
- Export your Shopify marketing attribution or sales report (such as ‘Performance by marketing channel’ or ‘Sales attributed to marketing’) for the period, filtered to first-time customers only.
- Export your ad spend from each platform’s reporting dashboard for the same date range.
- Match the referrer sources in Shopify to your platform spend (e.g. ‘paid social’ maps to Meta + TikTok; ‘paid search’ maps to Google).
- Divide channel spend by the number of new customers attributed to that channel in Shopify.
- Compare your channel CAC against your average order value, gross margin percentage, and blended contribution margin.
- Identify which channels produce customers with a CAC below your maximum allowable CAC (more on this below).
One important note on matching: Shopify’s referrer labels are not always perfectly granular. ‘Paid social’ may lump Meta and TikTok together unless you are using UTM parameters consistently across all campaigns. Before running this analysis, ensure every paid URL includes UTM source, medium, and campaign tags. This allows Shopify’s reports to separate channels properly.
Example CAC Calculation Across Three Channels
Here is a worked example using 30-day data from a Shopify store spending across three paid channels. The store sells a skincare set at an average order value of $68 and operates at a gross margin of 52%.
| Channel | Ad Spend (30 days) | New Customers (Shopify) | CAC | Avg Order Value | Gross Profit per Order | CAC vs Gross Profit |
|---|---|---|---|---|---|---|
| Meta Ads | $4,200 | 140 | $30.00 | $68 | $35.36 | Positive: +$5.36 |
| Google Ads | $2,800 | 70 | $40.00 | $68 | $35.36 | Negative: -$4.64 |
| TikTok Ads | $1,600 | 64 | $25.00 | $68 | $35.36 | Positive: +$10.36 |
On a purely first-order basis, TikTok is the strongest performer — lowest CAC and the healthiest margin after acquisition cost. Meta is marginally profitable. Google is currently acquiring customers at a loss on the first order. This does not mean Google should be switched off immediately; it means you need to bring lifetime value data into the conversation before making that call.
Defining Your Maximum Allowable CAC
Maximum Allowable CAC (mCAC) is the ceiling on what you can afford to spend to acquire one customer while remaining profitable. It is calculated using gross margin and, ideally, customer lifetime value.
| Average Order Value (AOV) | $68.00 |
| Gross Margin % | 52% |
| Gross Profit per Order (AOV × Margin) | $35.36 |
| Target Contribution Margin % (after marketing) | 15% |
| Marketing Cost Allowance (Gross Profit – 15% Target Margin) | $25.16 |
| Maximum Allowable CAC (first-order only) | $25.16 |
In this example, Meta ($30.00) and Google ($40.00) exceed the first-order mCAC of $25.16, whereas TikTok ($25.00) sits just within allowable acquisition cost to retain a 15% contribution margin after marketing. However, if your average customer repurchases 2.3 times over 12 months, your 12-month LTV is considerably higher than the first-order gross profit, and you can afford to pay more to acquire that customer. The key is knowing that number before you decide where to increase spend.
Do not scale a channel purely because its platform-reported ROAS looks strong. Always cross-check against Shopify’s first-time customer data and your actual gross margin. High ROAS on low-margin products or returning customers can mask a CAC problem that only becomes visible when you look at contribution margin.
How Referrer Attribution Works in Practice — and Its Limits
Shopify uses a last non-direct click attribution model by default. This means the final non-direct marketing channel recorded before checkout gets credit for the sale, ignoring direct visits. If a customer found you through a TikTok ad three days ago but converted after clicking a Google Shopping ad today, Shopify attributes the sale to Google. (If they instead visited directly before buying, TikTok would retain credit.) This is not perfect, but it is consistent and channel-neutral — unlike platform pixels, which each claim credit from their own perspective.
For a more complete picture, review both Shopify’s attribution data and your platform reports side by side. Where you see significant discrepancy — for example, TikTok claiming 200 conversions but Shopify showing only 60 referrals from TikTok — this gap is often a signal of assisted attribution: TikTok introduced customers who later converted through a different channel. Knowing this helps you understand the role each channel plays in your funnel, not just who closes the sale.

Using CAC to Make Reinvestment Decisions
Once you have a reliable CAC per channel, you can move from reporting to decision-making. The core question is: which channels are acquiring profitable customers at a sustainable cost, and which are not?
Consider three reinvestment scenarios based on the earlier example:
| Scenario | Channel | Action | Rationale |
|---|---|---|---|
| Scale | TikTok Ads | Increase budget by 30-40% | Lowest CAC, positive first-order margin, likely room to grow before efficiency drops |
| Optimise | Meta Ads | Review creative and targeting; maintain or slightly reduce budget | Marginally profitable — improve CAC before scaling |
| Investigate | Google Ads | Audit campaign structure, keywords, and landing pages before cutting | Above mCAC on first order; check if LTV justifies retention or whether budget is better redeployed |
The ‘investigate before cutting’ approach for Google is worth emphasising. Paid search often captures high-intent customers who have already been warmed up by another channel — if Google is converting customers who return and repurchase at higher rates than TikTok, a higher CAC may be entirely justified. Pull your repeat purchase rate by channel if you can, or segment cohorts by acquisition source in Shopify.
Tracking CAC Over Time — Not Just in One Period
A single month of CAC data is a starting point, not a conclusion. CAC fluctuates with seasonality, creative fatigue, auction competition, and product mix. Build a simple tracking sheet that records channel spend, new customers acquired (from Shopify), and CAC on a weekly or monthly basis. When you see CAC rising on a channel without a corresponding increase in LTV, that is your signal to refresh creative, adjust targeting, or pull back spend before the channel becomes unprofitable.
For operators managing multi-channel businesses — including marketplaces such as Shopee, Lazada, or TikTok Shop alongside a direct Shopify store — it is worth noting that marketplace channels have a different cost structure. On Shopee or Lazada, there is no traditional ad-to-CAC relationship in the same way, but you are paying commission fees, promotional subsidies, and voucher costs that act as an effective customer acquisition cost. These should be modelled separately and included in your overall channel profitability view.
If you sell across Shopify, TikTok Shop, Shopee, and Lazada simultaneously, calculate a comparable ‘effective CAC’ for each channel by dividing total channel marketing and promotional costs by new customers acquired through that channel. This gives you a like-for-like view across very different cost structures.
Where BrizoMarket Fits In
One of the practical difficulties in running this analysis manually is pulling consistent data across Shopify, ad platforms, and marketplace dashboards and reconciling it in a spreadsheet every month. BrizoMarket is built to consolidate revenue, cost, margin, and channel performance data across your sales channels in one place — including both Shopify stores and marketplace accounts — so that metrics like channel-level CAC and contribution margin are visible without requiring manual exports and pivot tables every reporting cycle. If you are managing meaningful ad spend across multiple channels, having that view in a single place reduces the lag between data and decision.
Practical Next Steps
- Audit your UTM parameter setup across all paid campaigns to ensure Shopify can separate channels accurately.
- Pull your Shopify marketing attribution or sales report (such as ‘Performance by marketing channel’ or ‘Sales attributed to marketing’) for the last 30-60 days, filtered to first-time customers only.
- Export your actual ad spend from each platform for the same period.
- Calculate CAC per channel using the formula: Channel Spend ÷ New Customers from Shopify.
- Calculate your gross profit per order and define your maximum allowable CAC based on your margin and LTV targets.
- Compare channel CAC against your mCAC and classify each channel as ‘scale’, ‘optimise’, or ‘investigate’.
- Set a monthly cadence to repeat this analysis and track CAC trends over time.
Understanding true CAC per channel is not a one-time exercise. It is the ongoing discipline that separates businesses that scale profitably from those that grow revenue while quietly eroding margin. The data is available inside Shopify — most operators simply have not built the habit of using it this way.
Get Clear on Your Channel Profitability
BrizoMarket helps e-commerce operators consolidate channel revenue, costs, and margins across Shopify and marketplaces — so you can make faster, more confident decisions about where to reinvest your ad budget.