How to Use TikTok Shop Campaign Analytics to Measure Whether Flash Sale Discounts Actually Increase Net Profit or Just Volume
Flash sales on TikTok Shop are seductive. The live countdown, the surge in orders, the dopamine hit of watching your unit count climb — it feels like winning. But for e-commerce owners managing margins across multiple channels, the real question is never ‘did we sell more?’ It is always ‘did we make more money?’ These are very different outcomes, and TikTok Shop’s campaign analytics give you enough data to tell them apart — if you know where to look and what to calculate.
This article walks through a structured approach to analysing TikTok Shop flash sale performance at the contribution margin level, not just the revenue level. It covers which metrics matter, which ones mislead, and how to build a simple post-sale profitability framework you can apply after every campaign.
Why Volume and Profit Diverge During Flash Sales
A flash sale discounts your selling price. Every percentage point of discount comes directly out of your gross margin unless your cost of goods falls in parallel — which it almost never does. At the same time, TikTok Shop charges commission fees on every transaction, affiliate commission if you are running creator campaigns, and your fulfilment costs remain fixed per unit regardless of the price you charged.
This means a 30% flash sale discount does not reduce your profit by 30%. It reduces your gross profit by a much larger proportion because you are discounting off the top line while your cost base stays roughly flat. On a product with a 40% gross margin, a 30% price discount can wipe out the entire margin and push you into a loss position on every unit sold.
The core question after any flash sale is not ‘how many units did we sell?’ — it is ‘what was our contribution margin per unit at the discounted price, and did total contribution margin increase or decrease compared to a normal trading day?’
The Metrics TikTok Shop Campaign Analytics Actually Shows You
TikTok Shop Seller Centre provides campaign-level reporting once a promotion ends. The key metrics available include: total GMV (gross merchandise value), units sold, number of orders, average order value, conversion rate from product page, estimated ad spend if you ran Spark Ads or in-feed ads alongside the sale, and affiliate commission paid. Some of these are inputs into your profitability calculation. Others are distractions.
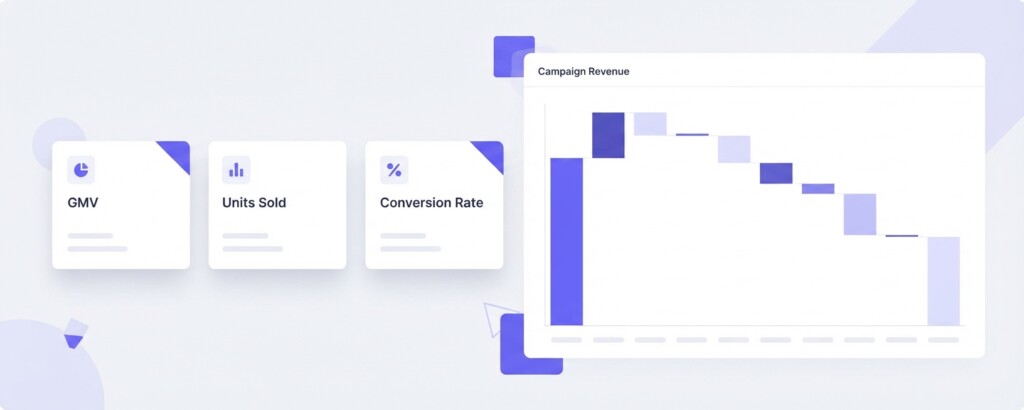
GMV is the most prominent figure TikTok will show you, and it is the least useful for profitability analysis on its own. GMV is gross revenue before returns, before platform fees, before your cost of goods. Treat it as a starting point, not a result.
Building a Flash Sale Profitability Statement
To determine whether a flash sale genuinely increased net profit, you need to reconstruct a mini contribution margin statement for the campaign. Here is the structure, illustrated with a realistic example.
Suppose you sell a skincare set. Normal selling price: $48. Flash sale price: $32 (33% discount). Your cost of goods is $14 per unit. TikTok Shop charges 3% platform commission. You are also running a 10% affiliate campaign. Fulfilment cost is $3.50 per unit. During the 4-hour flash sale, you sold 420 units. On a typical comparable Tuesday without a sale, you sell 60 units at full price.
| Flash Sale Revenue (420 units × $32) | $13,440 |
| Cost of Goods (420 × $14) | −$5,880 |
| Gross Profit | $7,560 |
| TikTok Platform Commission (3% of $13,440) | −$403 |
| Affiliate Commission (10% of $13,440) | −$1,344 |
| Fulfilment Cost (420 × $3.50) | −$1,470 |
| Flash Sale Contribution Margin | $4,343 |
Now run the same calculation for a normal Tuesday at full price, scaled to the same 4-hour period (approximately 60 units for the full day, so roughly 10 units per 4 hours — but let us use the full day for a fairer baseline comparison).
| Normal Day Revenue (60 units × $48) | $2,880 |
| Cost of Goods (60 × $14) | −$840 |
| Gross Profit | $2,040 |
| TikTok Platform Commission (3% of $2,880) | −$86 |
| Affiliate Commission (10% of $2,880) | −$288 |
| Fulfilment Cost (60 × $3.50) | −$210 |
| Normal Day Contribution Margin | $1,456 |
The flash sale generated $4,343 in contribution margin versus $1,456 on a normal day — approximately 3× more. In this example the flash sale genuinely worked. But notice the margin percentage tells a different story. The flash sale contribution margin rate was 32% of revenue. The normal day rate was 51%. You made more total dollars but at a significantly compressed margin rate. Whether that trade-off is acceptable depends on your business goals and your stock position.
The Comparison Table: Flash Sale vs Normal Trading
| Metric | Flash Sale Day | Normal Trading Day | Difference |
|---|---|---|---|
| Units Sold | 420 | 60 | +360 units |
| Revenue | $13,440 | $2,880 | +$10,560 |
| Gross Profit | $7,560 | $2,040 | +$5,520 |
| Total Platform + Affiliate Fees | $1,747 | $374 | +$1,373 |
| Fulfilment Cost | $1,470 | $210 | +$1,260 |
| Contribution Margin ($) | $4,343 | $1,456 | +$2,887 |
| Contribution Margin (%) | 32% | 51% | −19 pts |
| Revenue per Unit | $32 | $48 | −$16 |
| Contribution per Unit | $10.34 | $24.27 | −$13.93 |
A flash sale can increase total contribution margin while simultaneously reducing contribution margin per unit and margin percentage. If you evaluate success purely on revenue or units sold, you will consistently underestimate the true cost of discounting. Always compare contribution margin in absolute dollar terms and as a rate.
When Flash Sales Actually Destroy Profit
The example above landed in a positive outcome, but the numbers can easily flip. Five common scenarios cause flash sales to reduce net profit rather than increase it.
- Deep discounts on low-margin products: If your gross margin before discounting is already 25% or below, a 30%+ flash sale discount will leave you with negative contribution margin on every unit. You are paying to sell your own product.
- High affiliate commission stacked on top of the discount: Running a 10–15% affiliate campaign alongside a 35% price cut means your channel costs alone can exceed your margin. Calculate combined fee exposure before launching.
- Volume cannibalisation from other channels: If your flash sale on TikTok Shop pulls demand away from full-price sales on Shopify or Shopee on the same day, total business contribution margin may decline even if TikTok numbers look positive in isolation.
- Post-sale return spikes: Standard TikTok Shop GMV reporting does not deduct returns or refunds after processing, as GMV is recorded at payment time. High return rates on flash sale orders — particularly common with apparel and beauty — can reverse a profitable-looking campaign result weeks later.
- Inventory written off at cost: Flash sales sometimes clear stock that was sitting idle, which can be genuinely profitable on a cash basis. But if you order additional inventory specifically to run the sale, factor in your total landed cost including freight and duties.
How to Read Incrementality: Did the Sale Create New Demand?
Incrementality is the portion of your flash sale volume that represents genuinely new demand — customers who would not have purchased at full price or who would not have discovered the product at all. If your 420 flash sale units largely represent customers who would have bought next week at $48, your profit outcome is dramatically worse than the calculation above suggests.
You can estimate incrementality by comparing your sales velocity in the two weeks after a flash sale against your pre-sale baseline. If post-sale velocity drops significantly below baseline, you have cannibalised future demand. If velocity holds or improves, the flash sale likely brought genuinely new customers into your funnel.
TikTok Shop does not provide a native incrementality report, so this analysis needs to be done manually using exported data or through a multi-channel analytics tool. Platforms like BrizoMarket allow you to pull TikTok Shop, Shopify and Shopee sales into a single view, making it easier to track post-campaign velocity across all channels simultaneously rather than analysing each in isolation.
A Step-by-Step Post-Flash-Sale Audit Process
- Export campaign data from TikTok Shop Seller Centre: Download the order-level export for the campaign period. Include product SKU, quantity, selling price, refund status, and affiliate flag.
- Calculate your true net revenue: Subtract platform commission and affiliate commissions from gross GMV. This is your net revenue — the amount you actually receive before your own costs.
- Apply COGS per SKU: Map your cost of goods to each SKU sold during the campaign. Avoid using blended averages if your product mix varied significantly during the sale.
- Add fulfilment costs: Apply your per-order or per-unit fulfilment cost, including pick and pack, last-mile delivery, and any returns handling fees.
- Calculate contribution margin: Net revenue minus COGS minus fulfilment costs equals contribution margin. This is your profitability measure before fixed overheads.
- Compare against your baseline: Use a comparable non-sale period (same day of week, similar season) to establish what contribution margin would have been without the flash sale.
- Check your post-sale velocity: Monitor daily units sold for 14 days after the sale. Compare to pre-sale baseline to assess whether demand was created or merely brought forward.
- Document your break-even discount: Calculate the maximum discount percentage at which the campaign remains contribution-margin positive. Use this as your floor for future campaigns.
Calculating Your Break-Even Flash Sale Discount
Before launching any flash sale, you should know the exact discount percentage at which the campaign stops being profitable at the unit level. The formula is straightforward.
Break-Even Discount = 1 − [(COGS + Fulfilment) ÷ (Normal Selling Price × (1 − Platform Fee Rate − Affiliate Rate))]
Because platform and affiliate fees are applied to the discounted selling price, this closed-form formula accounts for fee compression directly without requiring iterative calculations. The principle is: set a minimum acceptable contribution margin per unit (even if it is $1), and work backward to find the maximum discount that still delivers it. Do not run flash sales at discount levels below this threshold unless you have a specific strategic rationale such as inventory liquidation or new customer acquisition with a known lifetime value.
Key Takeaways and Next Steps
TikTok Shop’s campaign analytics are a useful starting point, but they report revenue and volume, not profitability. To understand whether a flash sale increased net profit or merely increased volume at a loss, you need to build a contribution margin statement for the campaign and compare it rigorously against a non-sale baseline.
The most important habits to develop are: calculating contribution margin per unit at the discounted price before launching any sale; auditing every campaign within 72 hours of completion; monitoring post-sale velocity to assess demand incrementality; and never treating GMV as a measure of campaign success.
For operators running across TikTok Shop, Shopify and Shopee simultaneously, the added complexity is cross-channel cannibalisation. A flash sale that looks profitable in TikTok Shop’s dashboard can still reduce total business profitability if it suppresses full-price sales elsewhere. Multi-channel profitability visibility is not optional — it is the foundation of sound campaign decision-making.
Measure Flash Sale Profitability Across Every Channel
BrizoMarket helps e-commerce operators track contribution margin, channel performance and campaign profitability across TikTok Shop, Shopify, Shopee and more — in one place.