How to Use Shopify Customer Reports to Segment High-LTV Buyers and Forecast Repeat Revenue by Acquisition Source
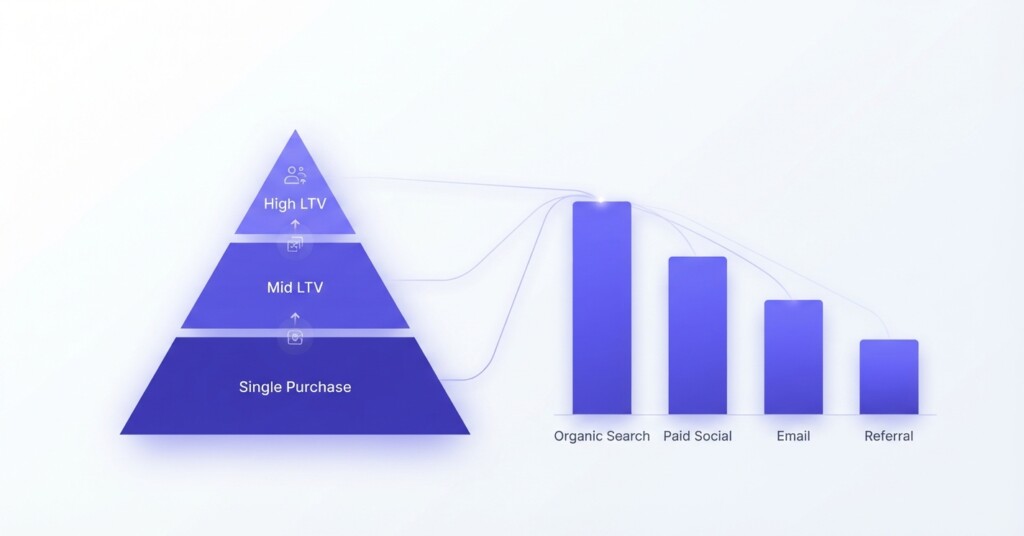
If you run an e-commerce business across Shopify and other channels like TikTok Shop, Shopee or Lazada, you already know that not all customers are equal. Some buy once and disappear. Others return repeatedly, spend more each time, and cost you almost nothing to retain. The challenge is identifying which customers belong in that second group — and tracing them back to the acquisition source that produced them.
Shopify’s built-in customer reports give you the raw material to do exactly this. But most store owners either ignore these reports or only look at surface-level metrics like total orders. This article walks through how to use Shopify customer data to segment high-lifetime-value (LTV) buyers, connect them to their acquisition source, and build a repeatable forecast for revenue from returning customers.
Why LTV Segmentation Changes How You Allocate Budget
Customer acquisition cost (CAC) only tells you what you paid to get a customer. Lifetime value tells you what that customer is actually worth over their relationship with your business. The ratio between the two — LTV:CAC — is one of the most important indicators of whether your marketing spend is sustainable.
Consider a store selling skincare products with an average order value (AOV) of $52. If a customer from a paid Meta campaign buys once and never returns, and your blended CAC is $38, your contribution margin on that customer is thin. But if a customer acquired through that paid campaign buys four times over 18 months with increasing basket sizes, that same $38 acquisition cost looks completely different.
The goal of LTV segmentation is not to celebrate your best customers — it is to identify which acquisition channels, campaigns, and product entry points consistently produce high-LTV buyers, so you can shift budget toward them.
What Shopify Customer Reports Actually Contain
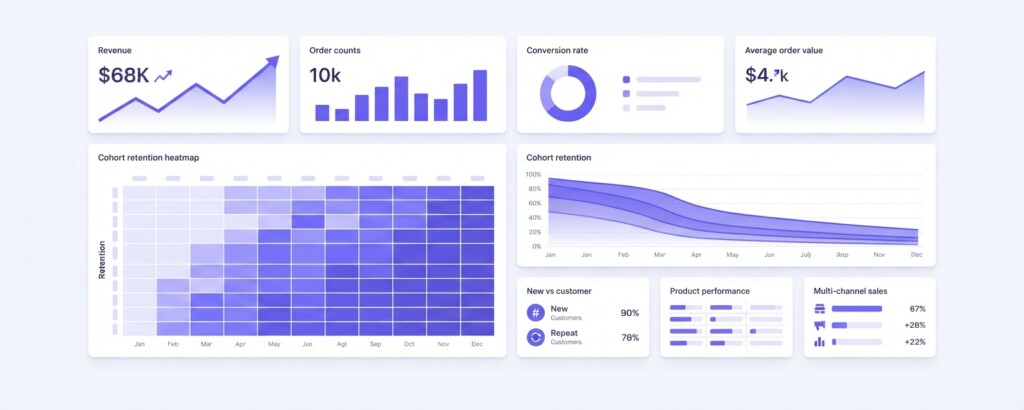
Shopify’s ‘Customers’ section under Analytics provides several prebuilt reports. The most useful for LTV analysis are: ‘Customers over time’ (or ‘New customers over time’), ‘Returning customers’, ‘First-time vs returning customer sales’, ‘Customer cohort analysis’, and ‘Customers by location’. In addition, the raw customer export (available via the Customers tab) provides summary metrics like total orders and total spend per customer, though obtaining first order dates requires cross-referencing order data or customer segments.
For acquisition source data, you need to cross-reference your UTM parameters captured through your marketing links with the customer records in Shopify. Shopify’s ‘Sales by traffic referrer’ report and the ‘Marketing’ section help bridge this gap, though coverage depends heavily on how consistently your team has tagged campaigns.
Step-by-Step: Building Your LTV Segmentation
- Export your customer and order data from Shopify to compile: email, first order date, total orders, and total spend.
- Calculate average order value per customer by dividing total spend by total orders.
- Identify your repeat purchase rate: the percentage of customers who have placed more than one order.
- Segment customers into three tiers — High LTV (3+ orders or spend above a threshold you define), Mid LTV (2 orders), and Single-purchase customers.
- Tag each tier against their first-order acquisition source using UTM data, referrer reports, or marketing attribution from your Shopify Marketing section.
- Calculate the average LTV per acquisition source across each tier.
- Identify which sources over-index in the High LTV segment relative to their share of total customers.
A practical LTV threshold depends on your category and margin structure. For a consumables business with 60-day replenishment cycles, three orders over 12 months might indicate a high-LTV customer. For a furniture store, even two purchases within two years could place a buyer in the high-value tier.
Sample LTV Segmentation by Acquisition Source
| Acquisition Source | Total Customers | % High LTV | Avg. Total Spend | Avg. Orders | Blended CAC |
|---|---|---|---|---|---|
| Organic Search (Google) | 1,840 | 34% | $218 | 3.6 | $0 |
| Paid Search (Google Ads) | 2,310 | 19% | $147 | 2.3 | $41 |
| Meta Ads (Facebook/Instagram) | 3,050 | 12% | $104 | 1.8 | $38 |
| TikTok Shop Referral | 870 | 8% | $89 | 1.4 | $22 |
| Email / SMS | 640 | 48% | $261 | 4.1 | $6 |
| Referral / Word-of-Mouth | 420 | 41% | $244 | 3.9 | $0 |
Reading this table, organic search and email produce the highest proportion of high-LTV customers and the highest average spend. Meta Ads brings in the most volume but has a low high-LTV rate of 12% and a CAC of $38 against an average spend of $104 — meaning contribution margin is under pressure once COGS, fulfilment, and platform fees are factored in.
Do not assume a low CAC automatically makes a channel profitable. TikTok Shop referrals show a CAC of $22, but with average spend of only $89 and a likely lower repeat rate, the actual margin contribution may be weaker than channels with higher acquisition costs but stronger LTV.
Calculating LTV Properly: The Formula You Should Use
There are several ways to calculate LTV. For practical forecasting purposes, a simple but effective approach is:
| Average Order Value (AOV) | $52.00 |
| Average Purchase Frequency (orders per year) | × 2.8 |
| Average Customer Lifespan (years) | × 1.9 |
| Gross LTV | $276.64 |
| Less: Blended COGS & Fulfilment (45%) | – $124.49 |
| Less: Returns & Chargebacks (3%) | – $8.30 |
| Contribution LTV (before acquisition cost) | $143.85 |
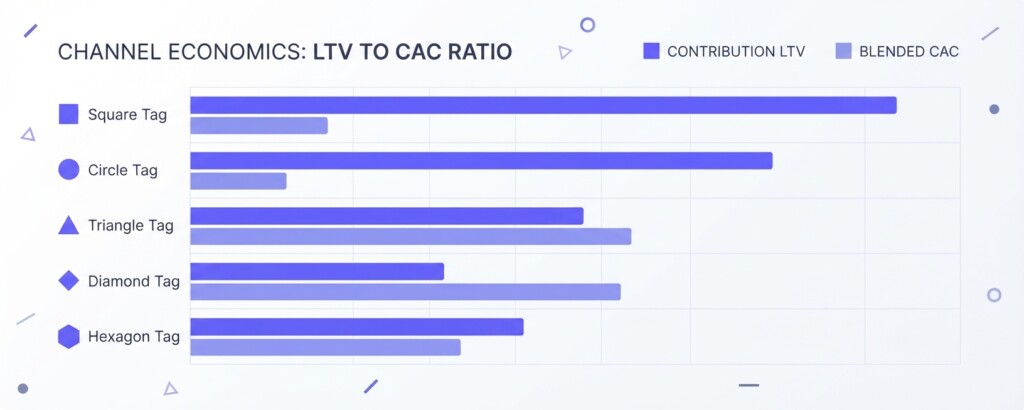
When you run this calculation by acquisition source using your segmented data, the picture becomes much clearer. A channel with a CAC of $41 but a contribution LTV of $143 gives you a healthy LTV:CAC ratio of 3.5:1. A channel with a CAC of $38 but a contribution LTV of $68 gives you a ratio of only 1.8:1 — which leaves almost no room for overhead, platform fees, or market downturns.
Forecasting Repeat Revenue from Your High-LTV Segment
Once you have segmented your customers and identified which acquisition sources produce reliable repeaters, you can use cohort-based forecasting to project future revenue from existing customers — separate from new customer acquisition targets.
The method works as follows: group customers by their first purchase month (acquisition cohort). Track what percentage of each cohort made a second purchase within 90 days, a third within 180 days, and so on. Average the repeat purchase rates across cohorts, then apply those rates to your current active customer base.
For example, if you have 3,200 customers who made their first purchase in the most recent quarter, and your historical data shows that 31% of customers make a second purchase within 90 days, you can project approximately 992 repeat orders in the next quarter from that cohort alone — before factoring in any new customer acquisition.
Multiply those projected repeat orders by your AOV to get a baseline repeat revenue forecast: 992 × $52 = $51,584. This is revenue you have a reasonable basis to expect without spending a single additional dollar on acquisition.
Connecting Shopify Data Across Multiple Channels
If you also sell on Shopee, Lazada, or TikTok Shop, the challenge is that these platforms do not share customer data with Shopify in the same way. You will not automatically see a TikTok Shop buyer appear in your Shopify customer list with a linked purchase history.
This creates a fragmented view of customer behaviour. A buyer might purchase on Lazada first, then find you on Shopify later through organic search — appearing as a ‘new’ customer in your Shopify reports when they are actually a repeat buyer from a different channel. This is a real blind spot that distorts your LTV calculations and your channel attribution.
Addressing this requires either building a centralised customer data view using email as a common identifier across platforms, or using an analytics tool that aggregates multi-channel order data into unified customer profiles. BrizoMarket, for instance, is designed to bring Shopify and other channel data together so that contribution margin and customer performance metrics reflect the full picture rather than just one storefront.
Practical Actions Based on Your Segmentation
- Increase retention spend (email sequences, loyalty programmes, SMS) specifically targeting customers from high-LTV acquisition sources before they churn.
- Reduce or restructure spend on acquisition channels where high-LTV rates are consistently below 15% despite reasonable CAC.
- Introduce post-purchase surveys to understand why high-LTV customers keep returning — then use those insights to improve onboarding for new customers from lower-LTV channels.
- Use Shopify’s customer tags to label high-LTV segments and trigger personalised marketing automations through Klaviyo or similar tools.
- Build a monthly cohort table comparing repeat purchase rates across acquisition sources so you can track whether LTV trends are improving or deteriorating over time.
- When evaluating new channel expansion (for example, adding TikTok Shop or Lazada), include projected LTV from that channel’s typical buyer profile alongside CAC and ROAS in your decision model.
Common Mistakes to Avoid
The most common mistake is optimising for ROAS alone. A campaign with a 4× ROAS looks strong on the surface, but if those buyers never return and your gross margin is 45%, the actual contribution after fulfilment and platform fees may be negligible. ROAS does not account for customer quality.
A second mistake is treating all first-time buyers as equivalent. Your Shopify reports allow you to see first-order product category, discount usage, and order size — all of which correlate with future behaviour. Customers who buy on their first visit without a discount code, and who purchase mid-to-high AOV products, tend to have materially better LTV profiles than those who were pulled in by a steep introductory offer.
Finally, avoid building your forecast on global averages. Repeat purchase rates vary significantly by product category, price point, and channel. A skincare brand and a homewares brand will have fundamentally different repurchase curves. Always anchor your projections to your own cohort data.
Key Takeaway
Shopify’s customer reports are more powerful than most store operators realise. When you move beyond session counts and top-line revenue to segment customers by LTV tier and connect those tiers to acquisition source, you get a clear picture of which channels are actually building your business — and which are generating one-time transactions that erode margin without compounding value.
Run this analysis quarterly. Track how your repeat purchase rate and LTV:CAC ratio trend over time by channel. Use the outputs to guide budget allocation, retention investment, and channel expansion decisions. That discipline — not ad spend volume — is what separates profitable multi-channel operators from those who are busy but barely breaking even.
Get a Clearer View of Customer LTV Across All Your Sales Channels
BrizoMarket helps e-commerce operators consolidate multi-channel data, calculate true contribution margins, and identify which acquisition sources are driving sustainable repeat revenue — not just first-order volume.