How to Build a Reorder Point Formula for Each SKU That Accounts for Platform Payout Delays and Supplier Lead Times
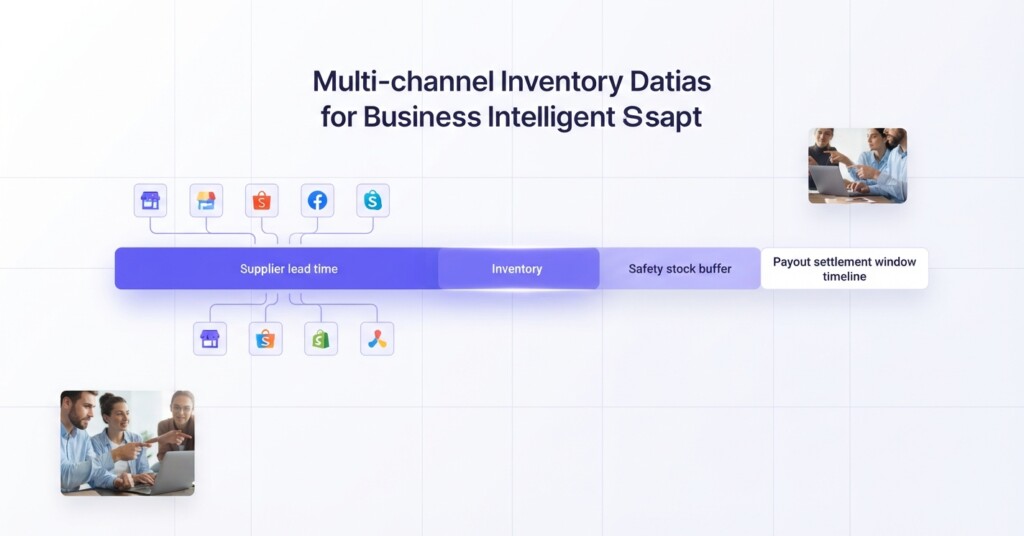
If you sell across Shopify, Shopee, Lazada and TikTok Shop simultaneously, your inventory decisions are more complex than a single-channel business. You are not just tracking when stock runs low — you are managing a cash gap between when customers pay and when platforms release those funds to you, while also absorbing unpredictable supplier lead times. Get the reorder point wrong and you either run out of stock mid-campaign or tie up working capital in excess inventory that your business cannot afford to hold.
This article walks through a reorder point formula built specifically for multi-channel e-commerce operators who need to factor in platform payout schedules alongside supplier lead times. Every component is explained with realistic numbers so you can apply it to your own SKU catalogue immediately.
Why Standard Reorder Point Formulas Fall Short for Multi-Channel Sellers
The textbook reorder point formula is straightforward: multiply your average daily sales by your supplier lead time, then add safety stock. That works adequately for a business with one sales channel, predictable demand and cash available on demand.
Multi-channel sellers face three complications the textbook ignores. First, platform payout delays mean you may have sold significant revenue on Shopee or Lazada but cannot access that cash for seven to twenty-one days depending on the platform cycle. This delays your ability to pay a supplier even when sales are strong. Second, demand velocity differs by channel, so a SKU that moves slowly on your Shopify store may spike on TikTok Shop during a live session, creating a sudden drawdown on shared inventory. Third, supplier lead times vary — an overseas manufacturer may need thirty days while a local distributor can fulfil in five — and the reorder point must reflect which supplier you are using for each SKU.
The core insight: your reorder point is not just an inventory threshold. It is a cash flow and operations decision. You need to be able to pay your supplier before stock runs out, which means payout timing is as important as lead time.
The Components of a Multi-Channel Reorder Point Formula
Here is the formula in full, broken into four components you can calculate for each SKU:
| Reorder Point (ROP) | = (Average Daily Units Sold × Supplier Lead Time in Days) + Safety Stock + Payout Buffer Units |
| Safety Stock | = (Maximum Daily Units Sold − Average Daily Units Sold) × Supplier Lead Time |
| Payout Buffer Units | = Average Daily Units Sold × Platform Payout Delay in Days |
| Combined ROP | = (Avg Daily Units × Lead Time) + [(Max Daily Units − Avg Daily Units) × Lead Time] + (Avg Daily Units × Payout Delay) |
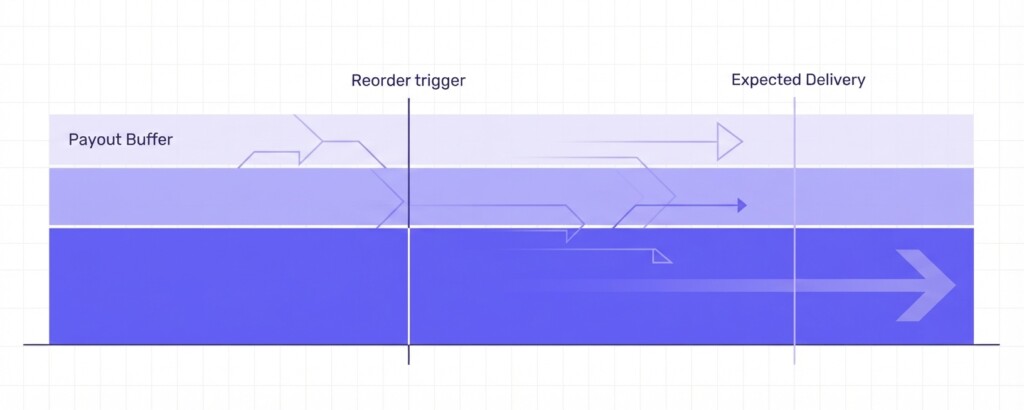
The payout buffer units represent the additional inventory you need to keep selling during the period when your cash is locked inside a platform settlement cycle. Without this component, you may place a reorder at the right inventory level but lack the funds to actually pay for it until days after the order should have been placed.
Worked Example: A Skincare SKU Sold Across Four Channels
Let us take a real product scenario. You sell a moisturiser (SKU: SK-MOI-200) across Shopify, Shopee, Lazada and TikTok Shop. Your supplier is based in South Korea and requires twenty-five days from purchase order to delivery at your warehouse.
Across all channels combined, your average daily sales for this SKU are forty units. On peak days — typically during Shopee flash sales or TikTok live sessions — you sell up to seventy units per day. Your platform payout mix is roughly 30% Shopify (seven-day payout), 35% Shopee (fourteen-day payout), 25% Lazada (fourteen-day payout) and 10% TikTok Shop (seven-day payout). A blended payout delay can be calculated to simplify the model.
| Channel | Share of Revenue | Payout Delay (Days) | Weighted Delay (Days) |
|---|---|---|---|
| Shopify | 30% | 7 | 2.1 |
| Shopee | 35% | 14 | 4.9 |
| Lazada | 25% | 14 | 3.5 |
| TikTok Shop | 10% | 7 | 0.7 |
| Total | 100% | — | 11.2 |
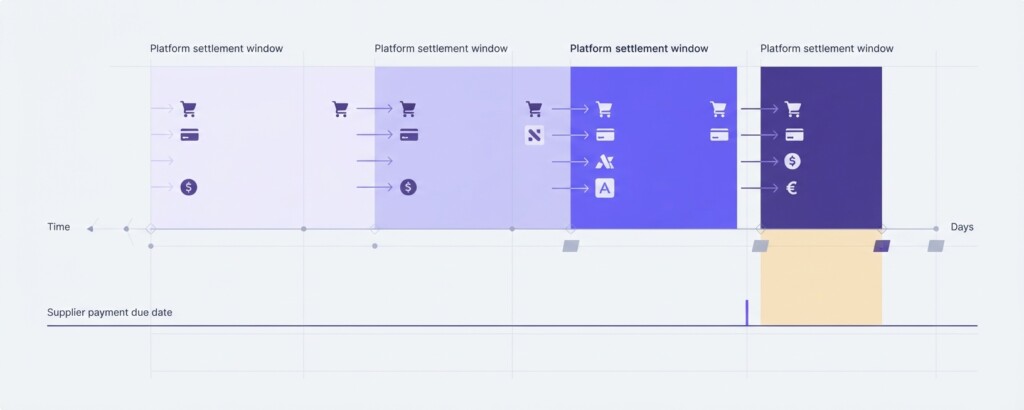
Your blended payout delay is approximately eleven days. This is the number of days on average that your cash is sitting inside platform settlement cycles rather than your bank account.
Now apply the formula:
| Average Daily Units Sold | 40 units |
| Supplier Lead Time | 25 days |
| Maximum Daily Units Sold | 70 units |
| Safety Stock | (70 − 40) × 25 = 750 units |
| Base Reorder Coverage | 40 × 25 = 1,000 units |
| Payout Buffer Units | 40 × 11 = 440 units |
| Reorder Point (ROP) | 1,000 + 750 + 440 = 2,190 units |
Without the payout buffer, you would have set your reorder point at 1,750 units. Including it raises the threshold to 2,190 units — a difference of 440 units. At a landed cost of, say, $4.50 per unit, that extra buffer represents roughly $1,980 in additional working capital you need to have available or pre-arrange with your supplier as a credit facility.
Adjusting for Channel-Specific Demand Velocity
The example above uses a combined demand figure across all channels. In practice, demand can shift between channels significantly, especially when you run promotions on one platform that do not run on others. A TikTok Shop live event might consume 200 units in a single evening while Shopify and Shopee remain at normal velocity.
The smarter approach for high-volume SKUs is to track daily units sold per channel separately and set channel-aware alerts. This does not change the reorder point formula — inventory is typically held in a single warehouse — but it helps you understand where demand spikes are likely to originate and how quickly they could drain your buffer.
Do not assume demand is evenly distributed across your channels. TikTok Shop live commerce in particular can produce velocity spikes that are five to ten times your daily average during a session. If you are planning a live event, check whether your current on-hand inventory clears your ROP threshold before the event begins, not after.
Calculating the Cash Position Required to Place a Reorder
The reorder point tells you when to order. The cash position check tells you whether you can. These two things must be considered together in a multi-channel business where a portion of your revenue is always locked in settlement.
Here is how to estimate whether you will have the cash available when the reorder point is triggered:
| Current Bank Balance | $12,000 |
| Receivables Locked in Platforms (Estimated) | $8,500 |
| Outstanding Supplier Payments Due | $5,200 |
| Estimated Cash Available When ROP Triggered | $12,000 − $5,200 = $6,800 |
| Cost of Reorder (Min Order Quantity × Unit Cost) | 2,000 units × $4.50 = $9,000 |
| Shortfall | $9,000 − $6,800 = $2,200 needed |
In this scenario, the business technically hits its reorder point but cannot fully fund the purchase order from available cash. The $8,500 locked in platform payouts will not arrive for several days. This is precisely where multi-channel operators get caught — strong sales performance masking a temporary cash shortfall that delays a supplier order, which then causes a stockout.
Building a Reorder Point Table for Your SKU Catalogue
For businesses with more than twenty active SKUs, managing reorder points manually is error-prone. The practical solution is to build a spreadsheet or connect your data to an analytics tool that surfaces ROP alerts automatically. The table below shows how to structure a working ROP reference for a small catalogue:
| SKU | Avg Daily Units | Max Daily Units | Lead Time (Days) | Safety Stock | Blended Payout Delay | Payout Buffer Units | Reorder Point |
|---|---|---|---|---|---|---|---|
| SK-MOI-200 | 40 | 70 | 25 | 750 | 11 | 440 | 2,190 |
| SK-SER-100 | 15 | 30 | 25 | 375 | 11 | 165 | 915 |
| SK-CLN-050 | 60 | 100 | 20 | 800 | 11 | 660 | 2,660 |
| SK-TON-150 | 8 | 14 | 30 | 180 | 11 | 88 | 508 |
| SK-EYE-025 | 22 | 40 | 18 | 324 | 11 | 242 | 962 |
Notice how SKU SK-CLN-050, despite having a shorter lead time than SK-MOI-200, carries the highest reorder point because of its higher average and maximum daily velocity. Lead time alone does not determine which SKUs need the most attention.
Handling Supplier Lead Time Variability
The formula above uses a fixed lead time. In reality, most suppliers — especially overseas manufacturers — deliver within a range rather than a fixed number of days. A supplier who quotes twenty-five days might deliver in twenty-two days on one order and thirty-one days on another, depending on production schedules, shipping delays and customs clearance.
To account for this, replace the fixed lead time with your maximum observed lead time rather than your average when calculating safety stock. This is deliberately conservative: you are protecting against the worst case rather than the expected case. For the base reorder coverage calculation (average daily units × lead time), you can continue to use the average lead time.
- Collect your last six to twelve months of supplier delivery records for each SKU.
- Calculate average lead time and maximum lead time from those records.
- Use average lead time for the base coverage component.
- Use maximum lead time for the safety stock component.
- Review and update these figures quarterly as supplier performance changes.
When to Revisit Your Reorder Points
Reorder points are not set-and-forget. Three situations should trigger a recalculation for specific SKUs. First, if a channel changes its payout schedule — platforms do occasionally adjust settlement terms — your blended payout delay changes and the payout buffer needs updating. Second, if you add a new sales channel or significantly change your revenue mix between channels, the weighted payout delay shifts. Third, if you onboard a new supplier with different lead times for a SKU, the entire calculation changes.
A quarterly review of your top twenty SKUs by revenue is a reasonable minimum. For high-velocity SKUs or SKUs with tight margin, monthly reviews are justified.
Using Analytics Tools to Automate ROP Monitoring
Manually tracking reorder points across fifty or more SKUs and four platforms is impractical for most e-commerce operators without dedicated inventory staff. Tools that connect your sales channels — Shopify, Shopee, Lazada, TikTok Shop — and surface inventory velocity and cash position data in one view make this considerably more manageable.
BrizoMarket, for example, pulls sales data across channels and allows you to monitor contribution margin and revenue per SKU in one place. When you can see channel-level velocity alongside your cost data, building and maintaining a reorder point model becomes a structured process rather than a monthly scramble through spreadsheets.
Key Takeaways and Next Steps
The reorder point formula for multi-channel sellers has three components: base coverage for lead time, safety stock for demand variability and a payout buffer for platform settlement delays. Ignoring the payout buffer leads to situations where you have hit your reorder threshold but lack the cash to place the order on time.
Start by calculating your blended payout delay using your channel revenue mix and each platform’s settlement terms. Then apply the formula to your ten highest-revenue SKUs first — this is where stockouts and working capital shortfalls cause the most damage. Build the full table for your catalogue once you have validated the model against a couple of SKUs you know well.
- Calculate blended platform payout delay for your current channel mix.
- Pull six months of daily sales data per SKU to determine average and maximum daily units.
- Confirm actual lead times from supplier delivery history, not just quoted lead times.
- Build or update your ROP table for your top ten SKUs by revenue.
- Set calendar reminders to review ROP figures quarterly or when any input changes.
- Pair your ROP model with a cash flow forecast so you can fund orders when they are triggered.
Track SKU Performance and Cash Flow Across Every Channel in One Place
BrizoMarket connects your Shopify, Shopee, Lazada and TikTok Shop data so you can monitor sales velocity, contribution margin and channel performance without stitching together spreadsheets. See how it supports smarter inventory and profitability decisions.