How to Use TikTok Shop Affiliate Analytics to Calculate the Real Cost of Creator Partnerships per Converted Order
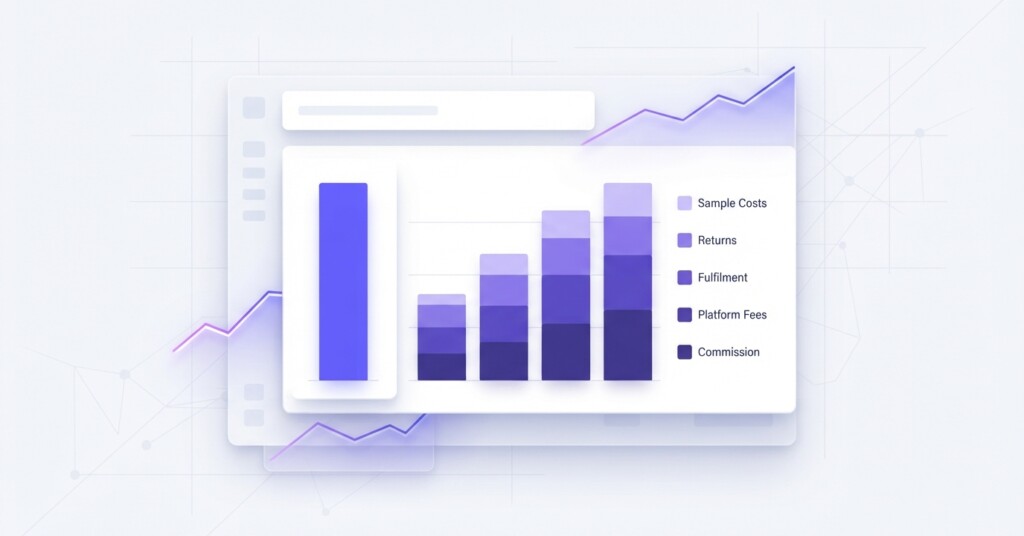
TikTok Shop’s affiliate programme has made it remarkably easy to recruit creators and push products to large audiences. But easy recruitment does not mean easy profitability. Many e-commerce operators look at total affiliate commission spend and assume that is the full cost of the channel. It is not. When you account for platform fees, fulfilment, returns, and the cost of samples sent to creators, the real cost per converted order is often significantly higher than the headline commission rate suggests — and for some product categories, creator partnerships destroy margin rather than build it.
This article walks through a structured approach to reading TikTok Shop Affiliate Analytics, building a cost model for each creator partnership, and arriving at a true cost per converted order — the number that actually tells you whether a partnership is worth continuing.
Why Headline Commission Rate Is the Wrong Number to Watch
When you set up a TikTok Shop affiliate collaboration, you agree to a commission rate — typically somewhere between 5% and 25% of the sale price depending on category and negotiation. Most operators treat this as the cost of the channel. But this logic only holds if every other variable is zero, and none of them are.
Consider a skincare brand selling a serum at $48. They offer a 15% commission rate. On paper, each sale costs $7.20 in affiliate fees. But before that sale happens, the brand may have sent the creator two product samples ($96 in retail value), the TikTok Shop platform takes its own transaction and referral fees, the return rate on affiliate-driven orders tends to run higher than direct orders, and fulfilment costs per order are unchanged. Stack all of that together and the real cost per converted order can be two to three times the commission figure alone.
The most important shift in thinking: stop measuring affiliate partnerships by commission spend and start measuring them by contribution margin per converted order. Commission is an input. Contribution margin is the output that determines whether the channel is viable.
Mapping the Full Cost Components of a Creator Partnership
Before you open Analytics, you need a clear list of every cost component that belongs in your model. There are six primary cost categories to track for each creator relationship.
- Commission fees: The percentage of each converted sale paid to the creator, drawn directly from order revenue.
- TikTok Shop platform fees: Transaction fees and any category-specific fees charged by TikTok Shop on each order, separate from the affiliate commission.
- Sample and seeding costs: The cost of goods sent to creators before any sale occurs, including shipping. These are sunk costs that must be amortised across actual converted orders.
- Product return costs: Affiliate-driven orders frequently have higher return rates. Returns generate reverse logistics costs and may result in unsellable inventory.
- Fulfilment cost per order: Pick, pack and shipping cost for each converted order, which does not decrease because the order came through an affiliate.
- Creator management overhead: Time spent recruiting, briefing, approving content, and managing payment disputes. For operators running 20+ creator relationships, this is a real cost.
How to Pull the Right Data from TikTok Shop Affiliate Analytics
TikTok Shop Seller Centre provides an Affiliate Analytics dashboard. The data you need for this analysis is spread across two sections: the Creator Analysis report and the Order Data export. Here is what to extract for each creator you are evaluating.
From the Creator Analysis report, pull: total clicks generated, total orders attributed, total GMV (gross merchandise value), total commission paid, and average order value. From the Order Data export, filter by the creator’s affiliate link or creator ID and pull: confirmed orders, cancelled orders, returned orders, and net settled orders. The difference between total attributed orders and net settled orders is your effective return and cancellation rate for that creator.
One important nuance: TikTok Shop Affiliate Analytics reports ‘confirmed orders’ which includes orders that are later returned or disputed. Always work from settled or completed orders only when calculating real economics. Using confirmed order counts inflates apparent performance.
Do not use GMV figures from the Affiliate Analytics dashboard as your revenue figure for margin calculations. GMV includes orders that are subsequently cancelled or returned. Use net settled revenue — the amount actually received after platform fees, refunds and adjustments — as your revenue base. The gap between GMV and net settled revenue is frequently 10–20% for affiliate-driven orders.
Building the Cost per Converted Order Calculation
Here is a practical worked example using a health supplement brand selling a collagen powder at $55 retail price. They partnered with three creators over a 30-day campaign period. Let us walk through the numbers for Creator A, who received two samples, posted four videos, and drove 43 completed orders.
| Gross revenue from settled orders (43 orders × $55) | $2,365.00 |
| Less: TikTok Shop platform fees (est. 5% of settled GMV) | – $118.25 |
| Less: Affiliate commission paid (18% rate on settled GMV) | – $425.70 |
| Less: Cost of goods sold ($18 COGS × 43 orders) | – $774.00 |
| Less: Fulfilment cost ($4.50 per order × 43 orders) | – $193.50 |
| Less: Sample cost (2 units × $18 COGS + $12 shipping) | – $48.00 |
| Less: Return processing cost (4 returns × $8 per return) | – $32.00 |
| Net contribution from Creator A partnership | $773.55 |
To get cost per converted order, divide total spend components (excluding COGS, which is captured in margin) by the number of net settled orders. In this case: ($118.25 + $425.70 + $193.50 + $48.00 + $32.00) ÷ 43 orders = $19.00 per converted order in channel-specific costs. That is 34.5% of the $55 sale price going to channel costs before you account for the cost of the product itself.
Comparing Creator Partnerships Side by Side
Once you build this model for each creator, the real value becomes comparison. Creators who drive high GMV are not always the most profitable. A creator with a smaller audience but higher purchase intent, lower return rates and lower commission demands can deliver better economics per order.
| Metric | Creator A | Creator B | Creator C |
|---|---|---|---|
| Commission rate | 18% | 12% | 20% |
| Settled orders | 43 | 91 | 28 |
| Return rate | 8.5% | 4.2% | 18.3% |
| Samples provided (units) | 2 | 3 | 5 |
| Net revenue per order | $55.00 | $55.00 | $55.00 |
| Total channel cost per order | $19.00 | $13.40 | $24.80 |
| Gross margin after channel costs | $18.00 | $23.60 | $12.20 |
| Contribution margin % | 32.7% | 42.9% | 22.2% |
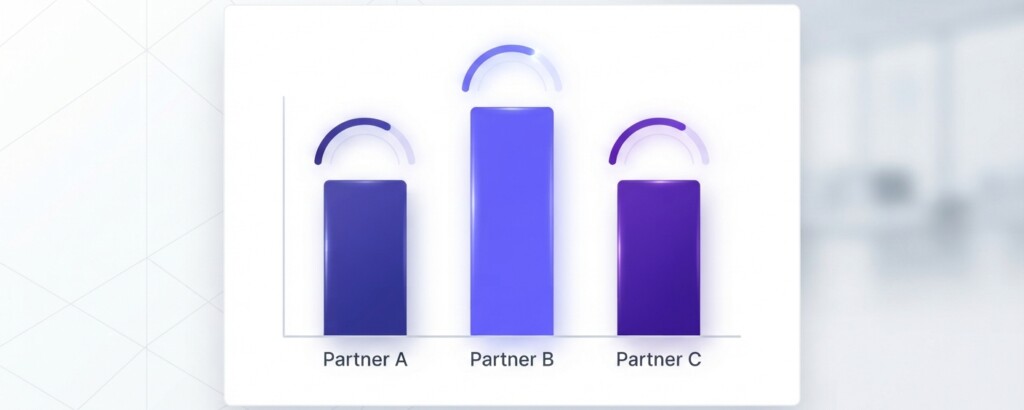
In this comparison, Creator B — despite a lower profile — is the strongest commercial partner. Their lower commission rate and significantly lower return rate make each converted order far more profitable. Creator C, who may appear impressive based on their follower count, is the weakest performer once the full cost model is applied. Their high return rate and heavy sample requirement are eroding margin on every order.
Understanding Return Rate as a Creator-Level Metric
Return rate is one of the most underanalysed metrics in TikTok Shop affiliate programmes. Returns vary significantly by creator — not just by product — because the creator’s content directly shapes buyer expectations. A creator who overpromises results, films with poor lighting that misrepresents colour or texture, or attracts an audience that does not match the product’s actual use case will generate a higher return rate regardless of what they sell.
Track return rate per creator from your order export, not from aggregate Affiliate Analytics figures. Aggregate figures mask creator-level variation. A 6% overall return rate could be masking one creator driving 22% returns while another drives only 2%. That distinction is commercially significant.
Amortising Sample Costs Across Actual Converted Orders
Samples sent to creators before campaign launch are sunk costs. They should be treated as a fixed investment per creator and divided by actual settled orders to understand their real impact on economics. If a creator receives five product samples and drives only 12 converted orders, the sample cost per order is material. If they drive 200 orders, the per-order impact becomes negligible.
This matters for creator selection decisions. Sending $200 in samples to a creator whose audience is poorly matched to your product — and who ultimately drives 8 orders — represents a cost per order of $25 from samples alone. Your investment decisions around creator seeding should be informed by historical conversion data per creator tier, not just follower count.
Connecting TikTok Shop Analytics to Your P&L
For finance managers and operators running multi-channel businesses across Shopify, Shopee, Lazada and TikTok Shop, the challenge is ensuring TikTok Shop affiliate costs are correctly captured in your channel P&L — not buried in a general marketing line.
Your TikTok Shop channel P&L should include a dedicated affiliate cost line that aggregates commissions, platform fees, and an amortised sample allocation. This allows you to compare channel contribution margin across platforms accurately. A common mistake is booking commission as a marketing expense while booking platform fees separately under payment processing — which fragments your true picture of TikTok Shop profitability.
Tools like BrizoMarket are designed to help multi-channel operators consolidate channel-level revenue and cost data into a unified view, making it easier to see TikTok Shop affiliate economics alongside your Shopify and Lazada performance in a single profit dashboard — rather than manually reconciling four separate platform exports.
Setting Commission Rates That Protect Margin
Most operators set commission rates based on competitive norms or creator negotiation leverage rather than a margin model. A more disciplined approach is to start from your target contribution margin and work backwards.
If your product sells for $55, your COGS is $18, fulfilment is $4.50, and platform fees are approximately 5% ($2.75), your gross margin before affiliate commission is roughly $29.75 (54.1%). If your target contribution margin after affiliate costs is 30% ($16.50), you have approximately $13.25 available per order for commission — which represents a maximum sustainable commission rate of around 24% in this scenario. Any creator demanding more than that, or whose return rate pushes costs above your model, should not be retained.
Build your maximum commission rate from your margin model before any creator negotiation begins. Know your walk-away number. Creator enthusiasm and follower count do not change your unit economics — only your pricing, COGS and costs can do that.
Practical Next Steps
- Export the last 60 days of TikTok Shop affiliate order data at creator level, filtering for settled orders only.
- Build a cost model for each active creator that includes commission, platform fees, samples, fulfilment and returns.
- Calculate cost per converted order and contribution margin percentage for each creator.
- Rank creators by contribution margin, not by total orders or GMV.
- Set a minimum acceptable contribution margin threshold and identify creators falling below it.
- For underperforming creators, either renegotiate commission rates, reduce sample investment, or pause the partnership.
- Establish a standard creator onboarding model that estimates expected settled orders before committing to sample investment.
- Incorporate TikTok Shop affiliate costs as a defined line in your channel P&L rather than aggregating under general marketing.
TikTok Shop’s affiliate programme can be a genuinely effective acquisition channel — but its economics are more complex than a single commission rate implies. Operators who build creator-level cost models and track contribution margin per converted order will consistently outperform those who manage the channel on GMV and commission spend alone.
Get a Clearer View of Your TikTok Shop Affiliate Economics
BrizoMarket helps multi-channel e-commerce businesses consolidate revenue, costs and margin data across TikTok Shop, Shopify, Shopee and Lazada — so you can see the real profitability of every channel and every creator partnership without manual reconciliation.