How to Calculate the True Cost of a Marketplace Promotion Before You Opt In
Marketplace platforms are generous with promotional invitations. Shopee, Lazada and TikTok Shop regularly invite sellers to join flash sales, mega campaigns and platform-wide discount events. The pitch is always the same: higher visibility, more traffic, more sales. What the invitation rarely spells out is the full financial cost of participating — and whether that cost is one your business can actually absorb.
For e-commerce owners running across multiple channels, the decision to opt into a marketplace promotion should never be made on gut feel or the promise of volume alone. It requires a structured pre-promotion profitability analysis. This article walks you through exactly how to do that, with realistic examples and the formulas you need.
Why Marketplace Promotions Are Riskier Than They Look
Joining a platform promotion is not the same as running your own discount. When you participate in a Shopee 9.9 or Lazada Birthday Sale, you are typically required to meet minimum discount thresholds set by the platform — often 20% to 30% off your listed price. In some cases, platform vouchers and platform-funded subsidies further distort the effective selling price, making it difficult to track what you actually received per unit sold.
On top of the mandatory discount, you still pay the standard commission fee, payment processing fee, and any shipping subsidies the platform requires. Advertising spend to gain prominent placement during the campaign is often expected on top of that. Each of these line items compounds the pressure on your margin, and many sellers only discover they sold at a loss after the campaign settles.
The goal of a pre-promotion analysis is not to decide whether to grow — it is to decide whether the growth from this specific promotion, at this specific discount level, delivers a contribution margin you can sustain. Volume without margin is not a business result; it is a cash drain.
Step 1 — Establish Your Baseline Unit Economics
Before you can evaluate any promotion, you need a clear picture of what each product unit costs and earns under normal trading conditions. This means building out a unit economics model for every SKU you are considering including in the promotion.
Start with your cost of goods sold (COGS) per unit. This should include the landed cost of the product — purchase price, freight, import duties and any warehousing costs attributable to that SKU. Then layer in the variable selling costs specific to the channel: platform commission, payment gateway fee, and fulfilment or shipping costs.
| Normal Selling Price (Lazada, per unit) | $45.00 |
| Less: Cost of Goods Sold (landed) | -$18.00 |
| Less: Platform Commission (8%) | -$3.60 |
| Less: Payment Processing Fee (2%) | -$0.90 |
| Less: Fulfilment & Shipping Cost | -$4.50 |
| Contribution Margin Per Unit (Normal) | $18.00 |
In this example, the product earns a contribution margin of $18.00 per unit at normal pricing — a 40% contribution margin rate. This is the benchmark against which you will measure the promotion scenario.
Step 2 — Model the Promotional Selling Price and Its Impact
Now apply the discount the platform is requiring. For this example, assume Lazada is requiring a minimum 25% discount to participate in the campaign. Your $45.00 product will be listed at $33.75. Recalculate all variable costs against the new price.
Note that platform commission is typically calculated on the promotional selling price, not the original price. Payment fees follow the same logic. So while your costs in dollar terms appear lower, your COGS remains fixed — and that is where the squeeze occurs.
| Promotional Selling Price (25% discount applied) | $33.75 |
| Less: Cost of Goods Sold (unchanged) | -$18.00 |
| Less: Platform Commission (8% of $33.75) | -$2.70 |
| Less: Payment Processing Fee (2% of $33.75) | -$0.68 |
| Less: Fulfilment & Shipping Cost (unchanged) | -$4.50 |
| Contribution Margin Per Unit (Promotional) | $7.87 |
The contribution margin has fallen from $18.00 to $7.87 — a 56% reduction. The contribution margin rate has dropped from 40% to 23%. This is before any promotional advertising spend to boost placement during the campaign.
Step 3 — Add Campaign-Specific Costs
Most sellers who participate in mega campaigns also invest in sponsored listings, flash deal slots, or affiliate commission top-ups to ensure their products appear prominently during peak traffic. These costs need to be allocated per unit based on expected volume.
If you plan to spend $500 on campaign ads and you expect to sell 200 units during the promotion, your ad cost allocation is $2.50 per unit. Add any platform campaign participation fees if applicable, and factor in the cost of additional customer service labour if the volume spike creates support demand.
| Cost Element | Normal Trade | Promotion Scenario |
|---|---|---|
| Selling Price | $45.00 | $33.75 |
| Cost of Goods Sold | $18.00 | $18.00 |
| Platform Commission | $3.60 | $2.70 |
| Payment Fee | $0.90 | $0.68 |
| Fulfilment & Shipping | $4.50 | $4.50 |
| Ad Spend Allocation | $1.20 | $2.50 |
| Total Variable Cost | $28.20 | $28.38 |
| Contribution Margin | $16.80 | $5.37 |
| Contribution Margin % | 37.3% | 15.9% |
With campaign advertising included, the contribution margin per unit in this scenario is $5.37 — roughly one-third of the normal trading margin. At this level, the business needs volume to justify participation, which means the volume assumption becomes critical.
Step 4 — Calculate the Break-Even Volume Uplift Required
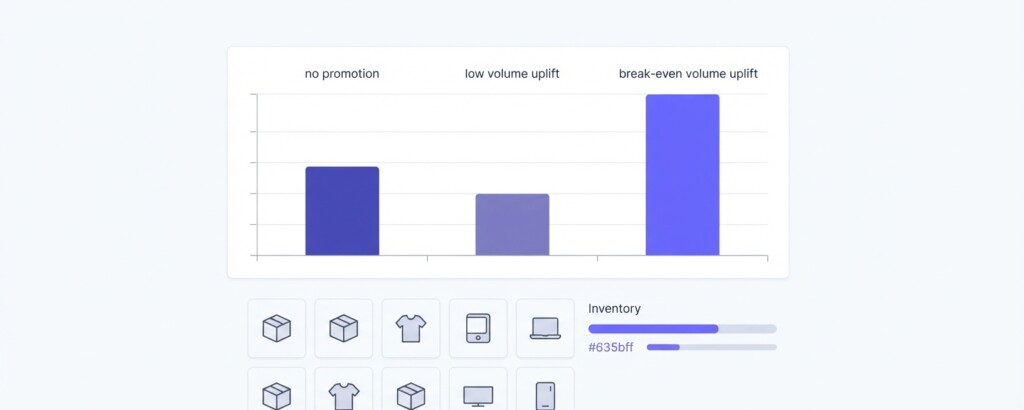
If your promotional margin is lower than your normal margin, you need a volume increase just to match the gross profit you would have generated without the promotion. This is the break-even uplift calculation, and it is one of the most important — and most overlooked — steps in promotion planning.
The formula is straightforward. Divide your normal contribution margin per unit by your promotional contribution margin per unit, then subtract one to get the required percentage increase in volume.
| Normal Contribution Margin per Unit | $16.80 |
| Promotional Contribution Margin per Unit | $5.37 |
| Break-Even Volume Uplift Required | 213% more units |
To break even on total contribution margin, you would need to sell more than three times your normal volume during the promotion period. If your normal weekly sell-through rate on this SKU is 40 units, you would need to sell approximately 125 units during the campaign just to match the profit contribution of an ordinary trading week. Be honest about whether that is realistic.
If a marketplace campaign requires a mandatory discount of 25% or more and your product already operates on a thin margin, the break-even volume uplift may be mathematically unachievable during the campaign window. Participating in the promotion can actively reduce your total profit for the month even if your revenue increases significantly. Revenue growth without margin growth is not a performance improvement.
Step 5 — Assess Inventory and Cash Flow Impact
Even if the margin analysis suggests the promotion is marginally viable, you need to consider the operational and cash flow implications. A large volume spike during a Shopee or TikTok Shop campaign places immediate pressure on your fulfilment capacity, stock levels and working capital.
If you pre-purchase additional inventory to meet projected campaign demand and the volume does not materialise, you are left with excess stock that was bought at normal cost but may need to be sold at a further discount. This downside scenario should be modelled explicitly.
- Calculate the maximum units you can fulfil without placing an additional stock order, and check whether that ceiling limits your upside.
- If you are placing a special stock order for the campaign, calculate the total cash outlay and the payback period at promotional margin rates.
- Identify whether settlement timing from the marketplace (typically 7–14 days post-campaign) creates a cash flow gap against any stock invoices coming due.
- Review your returns and refund rate for previous promotions — campaign-driven sales often have higher return rates, which will erode your realised margin further.
- Check that your logistics partner or 3PL can handle the volume spike without incurring penalty fees or causing delayed fulfilment that triggers platform service score penalties.
Step 6 — Compare Across Channels Before Committing
Multi-channel operators have an important advantage: they can choose where to direct their promotional energy. Before committing to a Lazada or Shopee campaign, compare what the same discount applied to your Shopify direct-to-consumer channel would yield. Without the platform commission, your Shopify margin at the same promotional price will generally be materially higher.
| Channel | Promo Price | COGS | Fulfilment / Shipping | Commission / Fees | Ad Allocation | Contribution Margin | CM% |
|---|---|---|---|---|---|---|---|
| Shopify (DTC) | $33.75 | $18.00 | $0.00 (customer paid) | $1.35 (gateway) | $3.00 (paid ads) | $11.40 | 33.8% |
| Lazada Campaign | $33.75 | $18.00 | $4.50 | $3.38 (commission + fee) | $2.50 (campaign ads) | $5.37 | 15.9% |
| TikTok Shop | $33.75 | $18.00 | $3.00 (subsidy) | $4.05 (commission + fee) | $4.00 (affiliate + ads) | $4.70 | 13.9% |
This comparison does not mean marketplace promotions are always the wrong choice. Marketplace campaigns can build brand awareness, attract new customers and improve your platform ranking — outcomes that have indirect value. But those benefits need to be weighed honestly against the margin cost, not used as a blanket justification for unprofitable participation.
Using Analytics to Make This Analysis Repeatable
Running this analysis manually for each promotion across multiple SKUs and channels is time-consuming. Businesses that operate across Shopify, Shopee, Lazada and TikTok Shop simultaneously need a way to pull together channel-level cost data, actual margin by SKU, and post-campaign settlement figures in one place.
BrizoMarket is built specifically for this kind of multi-channel profitability work — pulling sales and cost data from your connected channels so you can analyse contribution margin by SKU and channel without rebuilding spreadsheets after every campaign. If you are running promotions regularly across several platforms, having that data structured and accessible makes the pre-promotion analysis faster and the post-promotion review far more actionable.
After the Campaign — Close the Loop
Every promotion analysis should be followed by a post-campaign review using actual settled figures. Compare your projected margin per unit against the realised margin, check whether the volume uplift met the break-even threshold, and document whether the campaign was worth participating in. Over time, this creates an institutional knowledge base that makes future promotion decisions faster and more grounded.
Key metrics to review post-campaign include: realised contribution margin per unit, total units sold versus projection, return and refund rate versus normal trading, ad spend efficiency during the campaign window, and net new customers acquired versus repeat buyers.
A promotion that delivers high volume but low margin can still be worthwhile if it brings a meaningful number of first-time customers who convert into repeat buyers at full margin. Capture new-customer data from the settlement report and track repeat purchase behaviour over the following 60 to 90 days to assess the true return on your promotional investment.
Practical Takeaways
- Never evaluate a marketplace promotion using revenue or units sold alone — always calculate contribution margin per unit at the promotional price.
- Include all variable costs: COGS, platform commission, payment fees, fulfilment, and campaign ad spend.
- Calculate the break-even volume uplift required before committing, and assess honestly whether it is achievable.
- Model the cash flow impact of pre-buying stock for the campaign against your settlement timeline.
- Compare the promotional margin across channels — the same discount may deliver significantly different outcomes on Shopify versus Lazada.
- Run a post-campaign reconciliation using actual settled figures, not platform dashboard estimates.
- Track new customers acquired through the campaign and their subsequent behaviour to assess the full promotional return.
Marketplace promotions can be powerful growth tools when they are entered into with clear eyes and solid pre-analysis. The sellers who benefit most are those who treat each campaign invitation as a financial decision rather than a growth opportunity too good to pass up. The math is not complicated — but it needs to be done before you opt in, not after the settlement arrives.
Analyse Your Channel Margins Before Your Next Promotion
BrizoMarket helps multi-channel e-commerce businesses track contribution margin by SKU and channel — so you can evaluate promotions with real data, not estimates.